3 State of Local Infrastructure
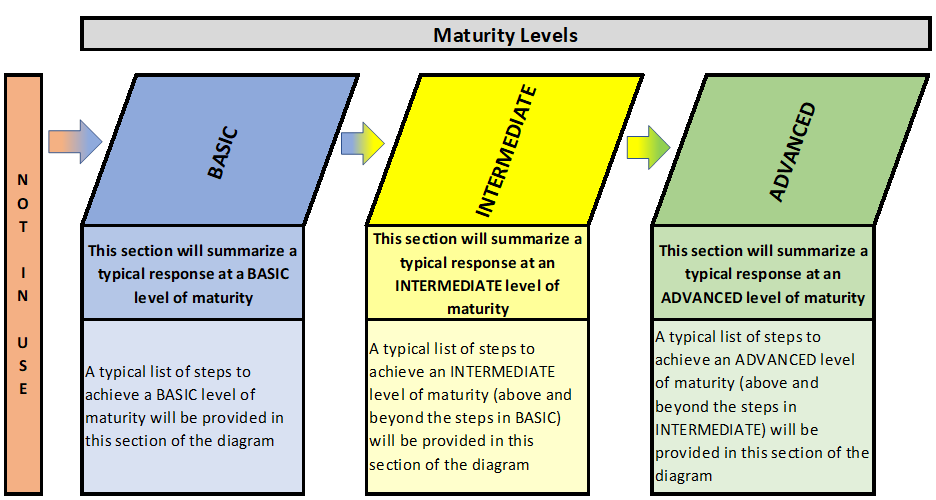
This framework is intended for municipalities of all sizes and maturity levels. The use of maturity diagrams within this framework will assist municipalities to identify their current levels of maturity for each AM area. Furthermore, for municipalities that have a desire to move to a higher level of maturity over time, the diagrams will provide potential approaches to doing so. To more easily depict the maturity levels ascribed to specific questions posed within the framework, the following diagram will be utilized for each question:
This document is intended to help municipalities make progress on their asset management planning. By enhancing the readers’ understanding of asset management maturity, they can more accurately determine their current, and work toward achieving the desired or appropriate, level of maturity for their municipality.
The asset management framework can be likened to a continuum, whereby municipalities should aim to implement the components described in a subsequent maturity level. For example, municipalities that are not practicing asset management should strive to meet components at the basic level, and likewise, municipalities that currently meet the basic or intermediate levels should strive to advance their practices to meet the components of the next level. However, it should be noted that during this self-assessment process a municipality may decide to skip over maturity levels (i.e. move from basic to advanced, skipping intermediate). This is perfectly acceptable. Further, not every municipality will need to strive for the highest level of maturity in every area. For example, it may not make sense for a small municipality to meet certain advanced level components.
Readers can use the following descriptions of the maturity levels to guide their assessment throughout the various sections of this framework:
Municipalities that are not undertaking the components described in a particular section of this framework should focus on meeting the basic level requirements outlined in the maturity level diagram.
At the basic level of maturity, a municipality is undertaking the components of asset management shown in blue and will take steps to advance their asset management by implementing the components described under the intermediate level heading.
At the intermediate level of maturity, a municipality is currently meeting the requirements shown in yellow and to advance their asset management will take steps to implement the components described under the advanced level heading.
At the advanced level of maturity, a municipality is currently meeting the requirements shown in green.
These maturity framework visuals are found throughout this document. Preceding all maturity level diagrams is a self-assessment question for the reader to consider to help determine where their municipality best fits within the framework.
The capital assets of a municipality exist for the purpose of delivering services, either directly or indirectly, to the public. In order to track and determine how well capital assets are performing in this regard, an asset inventory containing appropriate information on each asset should be collected and maintained. From this data, the “state of a municipality’s local infrastructure” can be determined and evaluated to provide the foundation for decisions and recommendations within the asset management planning process.
This chapter focuses on the process of undertaking a state of local infrastructure analysis. A municipality can prepare for this analysis by creating and updating an asset register, which is also an important tool for maintaining asset inventory information. Discussion will focus on the following:
1. Use and importance;
2. Asset attributes;
3. Level of asset detail;
4. Asset valuations;
5. Condition assessments;
6. Risk and criticality;
7. Age/condition profile; and
8. Updating the asset register.
Infrastructure for Jobs and Prosperity Act (IJPA) and O. Reg 588/17 Requirements
O.Reg 588/17 outlines the following requirements with respect to asset inventories:
A municipality’s AM plan must include the following (for each asset category):
a) A summary of the assets in the category;
b) The replacement cost of the assets in the category;
c) the average age of the assets in the category, determined by assessing the average age of the components of the assets;
d) The information available on the condition of the assets in the category; and
e) A description of the municipality’s approach to assessing the condition of the assets in the category, based on recognized and generally accepted good engineering practices where appropriate.
The information above must be available for core infrastructure by July 1, 2021 and for all other assets by July 1, 2023.
As per O.Reg 588/17, a municipality’s AM plan must be reviewed and updated at least every 5 years. Therefore, the information above must also be reviewed and updated at least every 5 years.
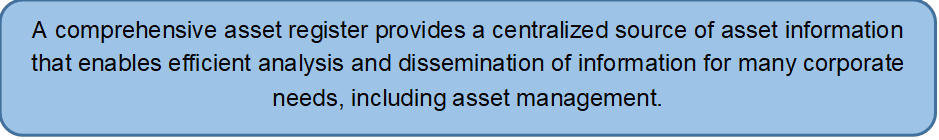
Is there one comprehensive asset register?
Asset information is used across multiple departments, services and activities within an organization. This includes PSAB 3150 compliance, FIR reporting, asset management, maintenance management, GIS, condition/inspection reports and “capital needs” studies or reports. In each of these areas, the common need is to have accurate, available, and up-to-date asset data upon which decisions can be made. With so many uses of asset data across an organization, a common struggle among municipalities is the ability to have all departments using the same asset data. This is commonly referred to as having “one version of truth” from an asset perspective.
Some organizations may keep asset registers in spreadsheets, while other organizations may keep them in more formal databases or systems that are designed for the specific purpose of maintaining asset data in an efficient and effective manner. Regardless of the technology in place, data integrity, completeness and reliability become critical to ensure accurate asset information is available to make decisions. Asset registers will be discussed further in Chapter 9 (Asset Management Tools).
Is there one comprehensive asset register?
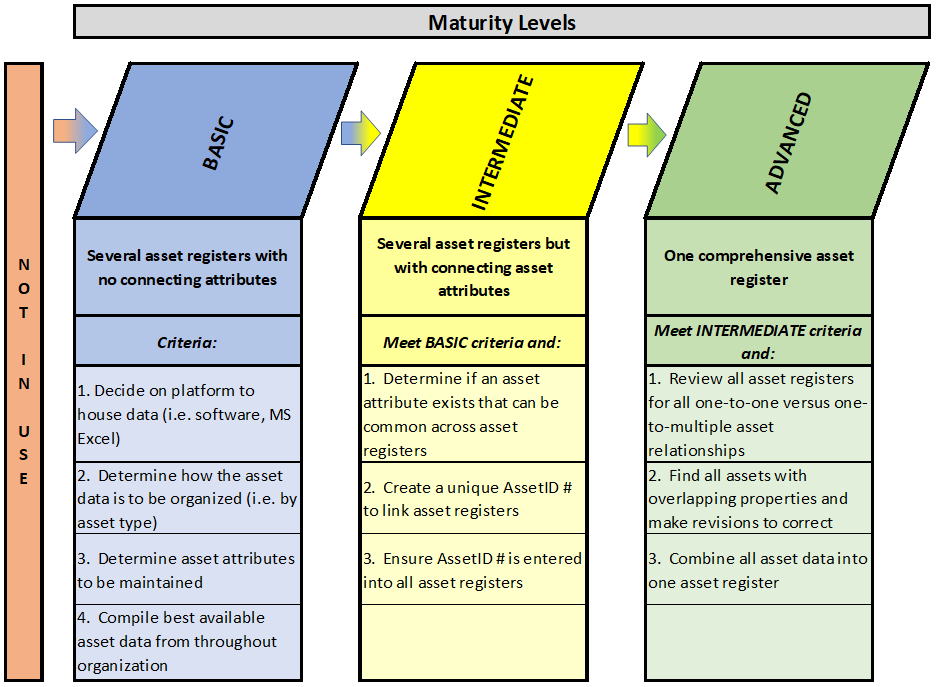
At the basic level of maturity, municipalities often have a number of asset registers in multiple formats with no connecting attributes. For example, different departments may each have an asset register for their own purposes, but with no objective of connecting the data between them. At this level, an asset register exists for asset management purposes.
As municipalities with no asset register(s) prepare to collect and maintain asset data, a few decisions will have to be made. First, where will the asset information be stored and maintained. There are many alternatives, such as using spreadsheets (i.e. MS Excel or Access) or obtaining specialized software. Second, how will the asset data be organized within the asset register, and which asset attributes will be collected and maintained. With these questions answered, the municipality will be in a position to gather the necessary information from various sources within the organization. Asset attributes will be discussed in more detail below.
At the intermediate level of maturity, municipalities establish linkages between the various asset registers, including the asset management register. This can be achieved through asset attributes such as a common asset identifier.
At the advanced level of maturity, municipalities operate with one comprehensive asset register, or multiple asset registers that are connected to provide “one version of truth”. While asset data may be stored in multiple registers, they are interconnected and controls are in place to ensure consistency, completeness and accuracy. To move from an intermediate to advanced level of maturity, the municipality should perform a review of all asset registers to identify all one-to-one asset relationships, where the same asset may reside in more than one asset register (i.e. PSAB register and GIS), versus one-to-multiple asset relationships (road segment could include base, surface, curbs, etc. or multiple road segments could equate to one segment in another register). Further investigation should be done to identify assets with overlapping properties across asset types. For example, consider a length of road complete with wastewater mains. The road segments may not exactly line up with those of the wastewater mains. When developing one comprehensive asset register, these overlapping properties will have to be managed in clearly defined business processes.
As discussed above, there are many uses for an asset register or multiple connected asset registers. The asset register is the foundation for any organization’s asset management process. This section describes various best practices for maintaining asset register(s).
There are two primary components of an asset register:
1. Physical asset register components: These components include the data required to maintain the levels of service that the assets provide. At a minimum, this includes physical attributes (i.e. description, location, size, material type) and condition, but may be extended to include technical data, criticality, functionality, capacity, and maintenance history.
2. Financial asset register components: These components include relevant asset financial details such as valuations and costing. In part, the financial asset register forms a part of a larger corporate finance system, through PSAB 3150 valuations, but also includes asset management values such as benchmark costs and current costs (i.e. replacement cost).
Physical and financial asset registers may exist as separate registers or may exist in combination as a single asset register. In cases where the registers are separate, there should be some level of integration or connectivity (manual or automated) between them to ensure common data is kept consistent. Maintaining a common and unique identifier for each asset is suggested for any asset register where asset data is maintained in separate areas. The most common unique identifier is the Asset ID.
A comprehensive asset register will often be made up of a number of integrated data sources, where each is primarily designed for specific department use. In situations where the asset register is not integrated and comprehensive, multiple asset registers exist and are maintained by specific departments or staff. The concern with having multiple asset registers from an asset management perspective is the challenge of ensuring “one version of truth”. For example, the Public Works department may believe they have 250 road segments with a replacement cost of $150 million. However, the Finance department may believe there are 200 road segments with a replacement cost of $250 million. In this situation, both departments are relying on different and inconsistent sources of information to meet their needs.
Perhaps the most critical best practice for any asset register is to establish parameters to ensure that there is only one version of truth for all asset management data. These parameters define the “primary data sources” for each type of data and how it will be used and managed across the organization. This may require documented business processes that are supported and enforced across existing department boundaries. The development of these processes may be especially challenging within organizations that have traditionally stored and maintained similar data in different data stores with no formal processes to define data truth.
Multiple Asset Registers for Multiple Uses
In some cases, municipalities may decide to have multiple asset registers that are disconnected. This can work where asset data is maintained for significantly different needs. Examples include:
· Asset management:
· Maintenance management; and
· Financial reporting.
These asset registers may have attributes that are similar, such as descriptions, size, material type, replacement cost, etc. However, they also have independent (i.e. unique) attributes, such as historical cost and amortization. Also, these asset registers can be maintained at differing levels of detail. For example, an asset management buildings inventory may have 20 components per building, however a financial reporting (PSAB) register may record buildings as a single asset. Both approaches in this example meet the specific needs of the users and stakeholders of each register. Municipalities will need to determine if a connection between the multiple asset registers is warranted. Where similar attributes exist, a beneficial first step would be to assess if the multiple asset registers are providing similar results (such as the total length of roadways).
The most important parameters for maintaining an asset register with one version of truth across multiple data sources include using unique asset ID numbers and developing an approach for accessing and maintaining the data.
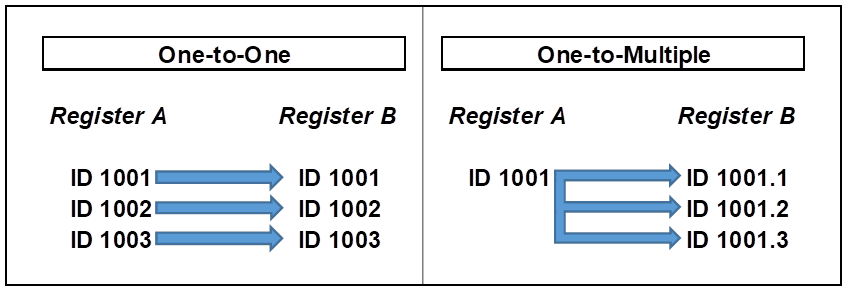
1. Defining Asset ID Values: Each asset within the asset register(s) should be assigned a unique asset ID value. This ID is used within asset inventories and spreadsheets to connect sources of asset data relevant to a specific asset across all data stores. For example, condition data, financial data, and maintenance data from different sources can be connected to assets through the asset ID. Keep in mind that this connection through asset IDs can be a one-to-one relationship or a “one-to-multiple” relationship. See below for examples of each.
Figure 3‑1
Mapping Asset ID Values
2. Accessing and Maintaining Data: Processes and rules should be developed for how data will be accessed and maintained across all sources of data. This includes the ability to see asset data (i.e. “read-only” permission) and the ability to edit asset data (i.e. “write” permission). These permissions can span to:
· All assets (i.e. certain staff can see all assets);
· Some departments/assets (i.e. only Public Works can edit road assets); or
· Particular asset attributes (i.e. only Finance can edit PSAB 3150 values or only Public Works staff can update roads condition ratings and replacement costs).
An optimal asset hierarchy or structure is developed in a manner such that both external and internal reporting needs are addressed. For example, from an external perspective, there is a need to report assets based on asset type for the annual audited financial statements, and by department for the FIR. However, a municipality may choose to internally track assets based on a structure that differs from external reporting needs.
An example of an internal asset categorization is as follows:
1. Roads Related;
2. Bridges and Major Culverts;
3. Water Supply;
4. Wastewater;
5. Stormwater Drainage;
6. Solid Waste;
7. Facilities (Buildings);
8. Vehicles, Machinery, and Equipment;
9. Land Improvements; and
10. Other.
Many of these asset classes can be broken down into various asset sub-classes.
Table 3‑1
Sample Asset Hierarchy
|
Asset Type |
Component |
|
|
Transportation |
Road |
Surface |
|
Base |
||
|
Structures |
Bridges |
|
|
Culverts > 3m |
||
|
Curb |
N/A |
|
|
Sidewalk |
N/A |
|
|
Streetlight |
N/A |
|
|
Traffic Management Device |
N/A |
|
|
Facility |
General Building |
Substructure |
|
Shell |
||
|
Interior |
||
|
Services |
||
|
Equipment and Furnishings |
||
|
Special Construction |
||
|
Water Supply |
Main |
Gravity |
|
Pressure |
||
|
Node |
Joint |
|
|
Valve |
||
|
Hydrant |
||
|
Storage Facility Pumping Station Treatment Facility |
Process Equipment |
|
|
Process Electrical |
||
|
Process Instrumentation |
||
|
Process Piping |
||
|
Build and Process Structural |
||
|
Building Architectural |
||
|
Building Services |
Municipal assets possess relationships and are associated with other municipal assets. For instance, an asset can have components or segments (discussed further in sections below), it can share a location with other assets, and it can be associated with one or multiple departments, or even associated with one or multiple asset classes or types.
Table 3‑2
Sample Asset Register
|
Asset ID |
Asset |
Asset Type |
Location |
FIR Department |
Internal Department |
|
RD 005 |
Tom St. |
Road – Infrastructure |
From Smith St. to John St. |
Transportation |
Public Works |
|
W 012 |
Watermain |
Water – Infrastructure |
Tom St. RD 005 |
Water |
Public Works |
|
WW 012 |
Wastewater Main |
Wastewater – Infrastructure |
Tom St. RD 005 |
Wastewater |
Public Works |
|
BLDG 02 |
West Arena |
Facility |
123 Smith St. |
Recreation and Culture |
Parks and Recreation |
|
EQ 56 |
Generator |
Equipment |
West Arena |
Recreation and Culture |
Parks and Recreation |
|
ST 003 |
Stormwater Pond |
Land Improvement |
Wilson Blvd. |
Stormwater |
Public Works |
|
SW 115 |
Truck |
Vehicle |
East End Landfill |
Solid Waste |
Public Works |
|
BR 203 |
Culvert |
Road – Infrastructure |
Tom St. |
Transportation |
Public Works |
Maintaining an asset hierarchy that provides some type of classification and structure to the municipal assets provides many benefits such as:
· External and internal reporting classifications;
· The ability to locate assets spatially; and
· Determine if related/associated assets impact each other.
9To what extent does your asset register meet internal and external reporting needs?
Regardless of the platform(s) used to retain asset information, it is important to strive towards the successful use of the available information for reporting purposes. There are a number of internal and external reporting needs within a municipality, therefore consideration should be given to the ability of the asset register to provide the necessary timely information for this purpose.
To what extent does your asset register meet internal and external reporting needs?
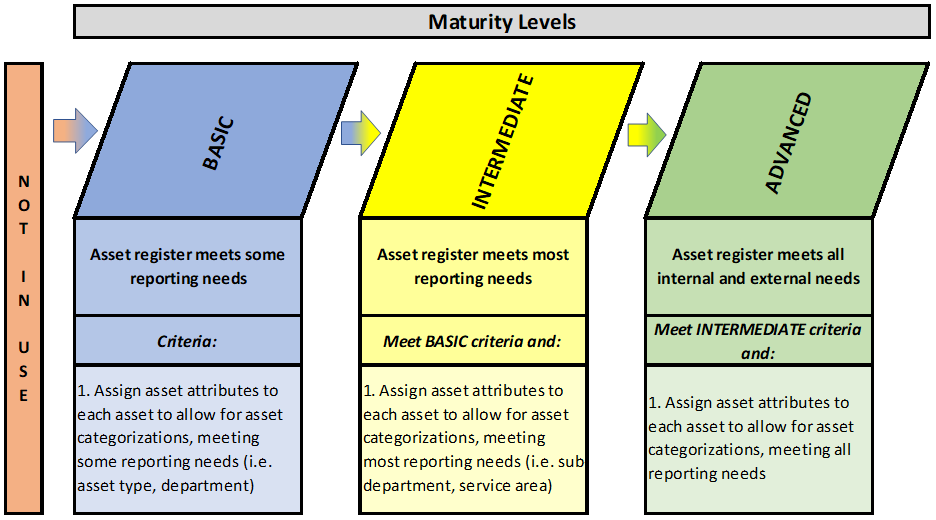
At the basic level of maturity, municipalities will find that their asset register will meet some of their reporting needs. These municipalities will assign asset attributes, such as asset type and department, to each asset, which will allow for asset categorizations for use in reporting. Initial focus should be on required reporting needs such as annual financial reporting.
At the intermediate level of maturity, the asset register will meet most of the municipal reporting needs, both externally and internally. The municipality will make use of more specific asset attributes, such as sub-department and/or service area, for asset categorization to be used in meeting most reporting needs.
At the advanced level of maturity, the municipality will ensure all necessary asset attributes are assigned to assets to allow for sufficient asset categorization to meet all reporting needs, both internally and externally. At this level, reports should be generated easily with very little need for manual formatting/adjustments.
The asset register should contain sufficient and accurate detail to meet a municipality’s internal and external reporting needs.
Internal reporting would relate to the ability to produce reports that facilitate the effective management of capital assets in the delivery of municipal services. External reporting would meet legislative, operational, and financial accounting reporting needs. Examples of each are as follows:
Table 3‑3
Sample Internal/External Reports
|
Internal Reporting |
External Reporting |
|
Annual Budget |
Audited Financial Statements (including segment reporting) |
|
Asset Management Planning |
Financial Information Return (FIR) |
|
Long-Term Forecasting and Financial Planning |
Grant Applications |
|
Maintenance Management |
Water and Wastewater Financial Plans |
|
Asset Condition/Inspection Reports |
Asset Condition/Inspection Reports |
Municipalities should determine what asset information is required, and in what classification or format for each reporting need. Reviewing all reporting needs before making refinements to an asset register can assist in identifying appropriate asset categorizations, as well as asset attribute data to collect.
Many of the reporting needs identified relate to either external accounting or internal (management) accounting reporting. The following chart from the “Guide to Accounting for and Reporting Tangible Capital Assets”, highlights the contrast in the requirements for financial accounting and internal management accounting.
Table 3‑4
Financial/Management Accounting Requirements
|
Financial Accounting |
Management Accounting |
|
Oriented to those external to the organization |
Oriented to those internal to the organization |
|
Reports governed by prescribed principles |
Reports and content are flexible |
|
Based on the needs of external users |
Based on the needs of management |
|
There is need for uniformity in reporting due to various user needs |
Management can specify the type and content of information needed |
|
Addresses all financial aspects of the local government as a whole for decision making |
Typically addresses certain aspects of the local government for decision making |
|
Focuses on financial position, annual results and cash-generating ability |
Focuses on issues such as determining prices to be charged, choices in product lines offered and product profitability |
|
Transaction and event based |
Includes transactions and events, future plans and any other required data |
|
Unified by the basic equation Assets – Liabilities = Net Assets |
Based on three principles: full, differential, and responsibility costing |
|
Mandatory |
Optional |
Source: Guide to Accounting for and Reporting Tangible Capital Assets, April 2007

To what extent does the municipality include detailed asset attributes in the asset register?
Asset attributes are characteristics that enable each asset to be clearly identified, quantified, described, evaluated, and accounted for. Asset attribute information requirements will vary between asset classes and between different asset types. Some attribute data will be held at the asset level while other data will be required at a more detailed component level. In addition, required attribute data will also vary by municipality. The level of detail required will, as a general rule, be dependent on the sophistication of the organization’s asset management processes and more so, the level of detail deemed important to the municipality. For an organization using basic asset management functions only higher-level attributes may be accounted for. Similarly, the level at which attribute data is collected should be related to the end use of the data. If assets are managed at a “whole asset” level it may not be necessary to collect and maintain detailed attribute data at a component level. Also, asset attribute data will depend on the type of information used for each asset type to determine valuation and expected levels of service.
To what extent does the municipality include detailed asset attributes in the asset register?
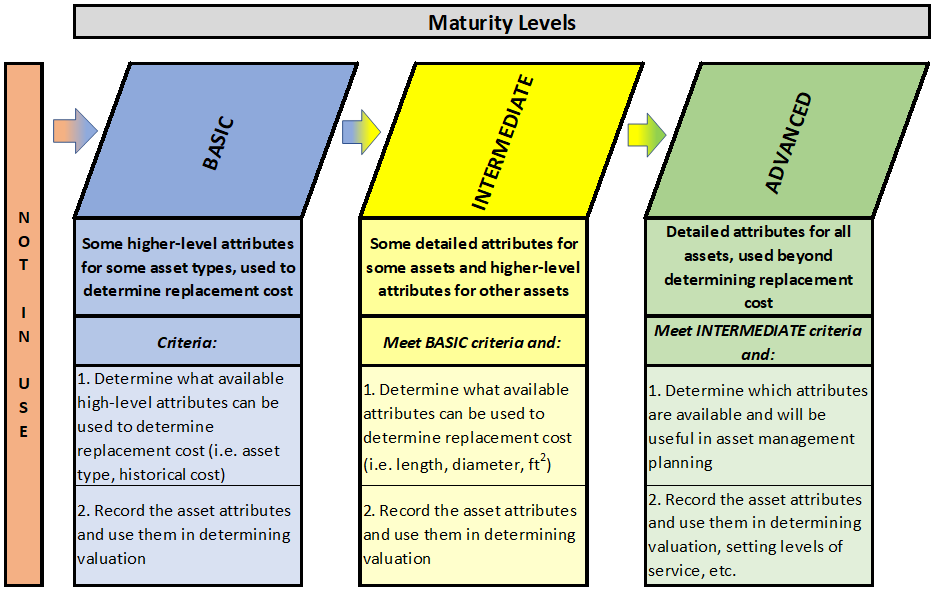
At the basic level of maturity, municipalities include within their asset data some higher-level attributes for some asset types. Municipalities need to determine for which attributes are available, easily recorded, and can be used to determine current valuation for each asset. It would be expected that, as a minimum, attributes such as asset type, location, useful life, age and historical cost would be included. Once the asset attributes have been recorded, they can be used in determining current valuation of the assets.
At the intermediate level of maturity, detailed attributes for some assets may be used, along with some higher-level attributes for other assets. This includes attributes at a more granular level, such as asset length, width, diameter and material type (if applicable) for more complex assets. This level of detail enables the municipality to calculate benchmark costs, such as cost per length, cost per diameter and/or cost by square foot/metre. This information allows for a more detailed costing to be completed, and also a more detailed levels of service analysis.
At the advanced level of maturity, detailed attributes would be documented and maintained for all assets. At this level, municipalities may include additional attributes that allow valuations to be done at a more detailed level. Attributes, such as functionality and capacity, are also used to set current levels of service and risk at a detailed level.
The following table illustrates examples of attribute types that can be considered as part of maintaining an asset register.
Table 3‑5
Sample Asset Register Attribute Types
|
Parameters |
Description of use |
|
Asset Identifiers, Location, and Descriptors |
To identify, describe and locate the asset. Will also define asset in terms of position in an asset hierarchy. |
|
Detailed Technical Data |
To individualize and quantify each asset from similar assets. |
|
Valuation Data |
Data that allows the organization to assess costs of the assets (both historical and current) and record/track amortization. |
|
Maintenance Data |
Data that identifies the work to be completed and work completed against an asset. |
|
Condition Data |
Data used to assess asset risk and determine actual remaining useful lives of assets. |
|
Predictive Data |
Data used to allow future behaviour of assets to be predicted. These would include deterioration curves and treatment effect details. |
|
Performance Data |
Data recording demand and capacity performance. Unplanned maintenance activity is recorded against asset including cause and costs. Planned maintenance procedures adopted for critical assets. |
|
Risk Data |
Data used to analyze risk of an asset’s failure and determine the risk to organizations if the asset were to fail. |
|
Lifecycle data |
Data used to plan future costs associated with operations, maintenance, creation, renewal, disposal of assets. The cost of any strategy should also be determined. |
|
Optimized Lifecycle Data |
Data used to optimize analysis of works taking into account the following factors: risk, maintenance, operations, life extension, age and condition of asset, asset decay, treatment options and cost. |
Source: Adapted from IIMM 2011 2.4.1 table 2.4.1.
The following attribute types will be discussed in more detail below:
1. Identification, Description, and Location;
2. Classification;
3. Physical – Components, Materials, and Dimensions;
4. Financial;
5. Condition;
6. Risk / Criticality;
7. Functionality and Capacity;
8. Maintenance; and
9. Predictive.
These attributes identify an individual asset, provide information as to its location and describe it in basic terms. Typically, these attributes may include:
Identifiers: details that enable the asset to be recognized.
· Asset ID or Asset Number: an identifier unique to the asset;
· Asset Name: where a name simplifies identification and location e.g. Smith Pavilion; and
· Parent Asset: often provides context to identifying the asset e.g. Smith Pavilion may be a child of XYZ Sports Ground.
Location: details that enable the asset to be located and/or related to other assets or features, can include:
· A street address;
· Start and end distances for linear assets;
· A floor level, or room within a building;
· A generic locality or local name;
· Precincts, neighbourhoods, wards, etc.;
· Map references; and
· Spatial coordinates (GIS data).
Classification attributes allow assets to be grouped for reporting and other management requirements, enable placement in asset hierarchies, and differentiate assets with differing service level requirements. Examples include:
· Asset Class;
· Asset Type;
· Hierarchy;
· Significance; and
· Ownership.
Physical attributes relate to the physical make-up of an asset that enable it or its components to be differentiated from other similar assets, quantified and described in detail. Examples include:
· Detailed descriptors;
· Structural details;
· Manufacturer (make, model and vin number);
· Insurance details;
· Materials; and
· Dimensions.
Financial attributes relate to financial aspects of assets. This may include:
· Asset valuation for asset management:
o Unit rate for replacement (i.e. benchmark cost);
o Current replacement cost;
o Asset consumption (deterioration curve/profile);
o Estimated service life (deterioration curve/profile);
o Maintenance costs;
o Capital costs for rehabilitation or enhancement/expansion activities; and
o Operating costs.
· Asset valuation specific to PSAB 3150:
o Historical cost;
o Accumulated amortization;
o Net book value;
o Useful life (amortization period);
o Age;
o Amortization rate;
o Amortization method (e.g. straight line based on age, consumption-based); and
o Remaining useful life.
Condition attributes relate to the physical condition of the asset. As municipalities may have various condition ratings scales across asset types, best practices would suggest that this be considered “raw data” and used to generate condition ratings that are consistent across all assets. For example, if a municipality decides that a consistent condition rating out of 10 is to be used for all assets, but a consultant provides the municipality bridge condition indexes (BCI) out of 100, then the BCI data would be treated as raw data to be used to generate an asset management condition rating out of 10 (i.e. BCI divided by 10). Having a consistent rating across all assets allows municipalities to compare assets across departments or service areas for asset management purposes.
Some assets will only require a single condition attribute while other more complex assets may require multiple condition attributes. More complex asset (i.e. road and bridge) condition ratings prepared by consultants typically include multiple ratings while less complex assets usually receive one overall condition rating. The municipality must determine which ratings are to be used for asset management purposes. Further discussion on condition ratings is provided in later sections.
Risk or criticality attributes relate to risks associated with assets. Typically, the attributes are related to the overall risk of the asset failing (i.e. exposure, probability of failure and consequence of failure). Risk attributes may also include items such as number of customers affected (in case of asset failure), existence of alternatives (detours for roads or reverse feeds for water supply), potential service delays, costing implications and social implications. Risk mitigation factors can also be accounted for within the calculations. Further discussions on risk and criticality are outlined in later sections.
Functionality and capacity attributes relate to the “fitness for purpose” of assets. These attributes define how well an asset is capable of performing compared to expected performance. This information can become very useful in determining levels of service (See Chapter 4) as well as asset risk (to be discussed below).
Functionality attributes typically relate to how well an asset is suited to the service provided while capacity attributes tend to relate to the scale of the service or the ability to cope with current or future use. For example:
· An area may lack functionality if no public toilet is provided;
· A building used to provide services to senior citizens that is not fitted with grab rails or wheelchair access would be lacking in functionality;
· Ongoing occurrences of roads congestion or subway congestion could suggest a lack of capacity; and
· Stormwater mains filled with roots or other debris may impact capacity.
Both functionality and capacity attributes are often derived from other attributes. For example, the functional adequacy of a road or sidewalk, may be related to its width dimension, its surface material, or both in comparison to the desired size and material of a road or sidewalk as defined by the municipality.
Functionality and capacity attributes support asset management planning as they relate to the ability of the asset to provide the defined desired levels of service. Long-term planning should include actions required to correct functionality and capacity issues, if expected levels of service indicate that corrections are needed. The degree and level of the functional or capacity issue will often be used to prioritize asset rehabilitation, replacement, upgrade/expansion, or the creation of new assets.
The table below provides some examples of functionality and capacity attributes:
Table 3‑6
Sample Capacity/Functionality Attributes
|
Capacity |
Functionality |
|
|
Roads Related |
Road Width Road Standard (i.e. urban vs. rural) Available Sidewalks Available Streetlights |
Comfort/Amenity Accessibility Usability Environment |
|
Bridges and Major Culverts |
Load Limit Bridge Width |
Comfort/Amenity Accessibility Usability Environment |
|
Water, Wastewater, and Stormwater |
Pressure/Flow Rate Interconnection/Distribution Future Demand Size (diameter) and Depth Gravity Factor |
Risk of Damage Public Rating Factor Properties Service Ratio Pressure/Flow Rate |
|
Buildings and Facilities |
Bathroom Availability Parking Spots Room Layout Available Storage Sports/Fitness Availability |
Comfort/Amenity Accessibility Usability Environment |
|
Vehicles, Machinery, and Equipment |
Available Power Available Storage – People Available Storage – Cargo |
Comfort/Amenity Accessibility Usability |
|
Land Improvements |
Usable Area Number of Benches/Picnic Tables Limited Parking Spots |
Comfort/Amenity (Public Toilets) Accessibility Usability Environment |
|
Solid Waste |
Available Landfill Volume Recycling Volume Roadside Collection Volume |
Environment Diversion Percent Number of Complaints |
The following is an example of a functionality assessment matrix that can be used to assess functionality across municipal buildings. This type of analysis can be used in assessing levels of service.
Table 3‑7
Sample Functionality Assessment Matrix
|
Functionality |
Bldg. 1 |
Bldg. 2 |
Bldg. 3 |
Bldg. 4 |
Bldg. 5 |
|
|
Indicator |
Aspects Considered |
|||||
|
Accessibility |
Location Hrs of Operation Design, Disabled Access |
P |
P |
P |
P |
P |
|
Accommodation |
Fit for Purpose |
X |
P |
P |
X |
P |
|
Room Layout |
Fit for Purpose |
P |
P |
P |
P |
P |
|
Circulation Spaces |
Suitability and Adequacy |
P |
P |
P |
P |
P |
|
Temporary Storage |
Location Quantity and Suitability |
X |
P |
P |
P |
P |
|
Permanent Storage |
Location Quantity and Suitability |
P |
P |
P |
P |
P |
|
Acoustics |
Adequacy – Internal and External |
X |
P |
P |
P |
P |
|
Fixed Joinery Items |
General Condition Quality and Quantity |
P |
P |
P |
P |
P |
|
Fittings and Furniture |
General Condition Quality and Quantity |
X |
P |
P |
P |
P |
|
Fixed Appliances |
General Condition Quality and Quantity |
P |
P |
P |
P |
P |
|
Window Coverings |
General Condition Quality and Quantity |
X |
P |
P |
P |
P |
|
Signage |
Location Quality and Appropriateness |
P |
X |
P |
P |
P |
|
Technology |
Access to IT Automation, etc. |
X |
X |
P |
P |
P |
|
Car Parking |
Availability Suitability |
P |
X |
P |
P |
P |
Maintenance attributes relate to the maintenance of assets throughout their lifecycle. This can include responsibility (owner, manager, etc.), inspection and/or testing schedules, work identified (defects), programmed work, work status (pending, outstanding or completed). In the event that the municipality has a maintenance management system, this data would be integrated into that system (see Chapter 9). Maintenance attributes can be useful in determining an asset’s condition, especially with assets that are difficult to assess (i.e. water mains, wastewater force mains, and difficult to access stormwater mains). It can also be useful in establishing future maintenance needs within the asset management process.
Predictive attributes allow future behaviour of assets to be predicted. These would include deterioration curves and treatment effect details. These enable the future state of an asset to be predicted. Attributes used for valuation such as useful life, remaining useful life, and age are often also included here.
In summary, the table below provides examples of individual asset attributes for various attribute types:
Table 3‑8
Sample Individual Asset Attributes
|
Attribute Type |
Attribute Examples |
||
|
Identification, description, and location |
Asset ID Street Address |
Asset Name GIS ID |
Parent Address |
|
Classification |
Asset Class Significance |
Asset Type Heritage |
Hierarchy Ownership |
|
Physical |
Detailed Descriptors Materials |
Structural Details |
Manufacturer |
|
Financial |
Historical Cost Age Consumption Pattern Renewal/Betterment |
Replacement Cost Useful Life (UL) Maintenance Costs |
Net Book Value Remaining UL Amortization Rate |
|
Condition |
Date of Assessment |
Method of Assessment |
Rating |
|
Risk |
Risk Type Consequence of Failure |
Exposure Date of Assessment |
Probability of Failure |
|
Functionality and capacity |
Expected LOS |
Measured LOS |
|
|
Maintenance |
Responsible Person Programmed Work |
Inspection Schedule Work Status (pending, outstanding, or complete) |
Work Identified |
|
Predictive |
Deterioration Curves |
Treatment Effect Details |
|
The table below outlines some basic attributes that may be seen for different asset categories or types:
Table 3‑9
Sample Basic Attributes
|
Asset Type |
Attribute Examples |
||
|
Roads |
Road Name Length Road Type |
“From” Street Width |
“To” Street Material Type |
|
Bridges |
Bridge Name Length |
Location (street) Width |
Structure Type |
|
Stormwater |
Road Name Length |
“From” Street/Node Diameter |
“To” Street/Node Pipe Material |
|
Water System |
Road Name Length |
“From” Street/Node Diameter |
“To” Street/Node Pipe Material |
|
Wastewater |
Road Name Length |
“From” Street/Node Diameter |
“To” Street/Node Pipe Material |
|
Facilities |
Address Number of Floors |
Material Type Dimensions |
Square Footage |
|
Solid Waste |
Address |
Odour Factor |
Diversion % |
|
Equipment and Vehicles |
Vehicle Number |
Department |
Insurance Information |
|
Land Improvements |
Address |
Material Type |
Quantity |

How are your assets broken down into components?
Identifying the level of asset detail to be recorded is a key to successful asset management. Insufficient or inaccurate data does not provide reliable inputs for decision making and reporting, while excessive data often creates confusion and leads to the data becoming unused and poorly maintained.
A good starting point for determining an appropriate level of detail is to identify how data is to be used and what level of detail is required for that use from a component perspective. (e.g. if an asset is to be managed and costed at a whole asset level there is probably little value in capturing condition data at a component level.)
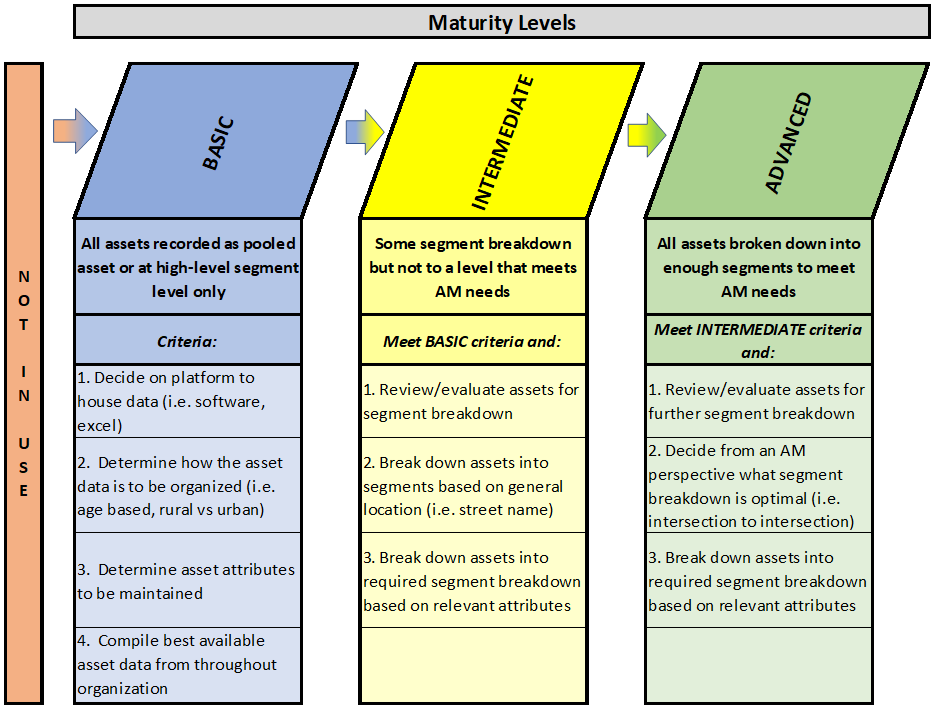
How are your assets broken down into components?
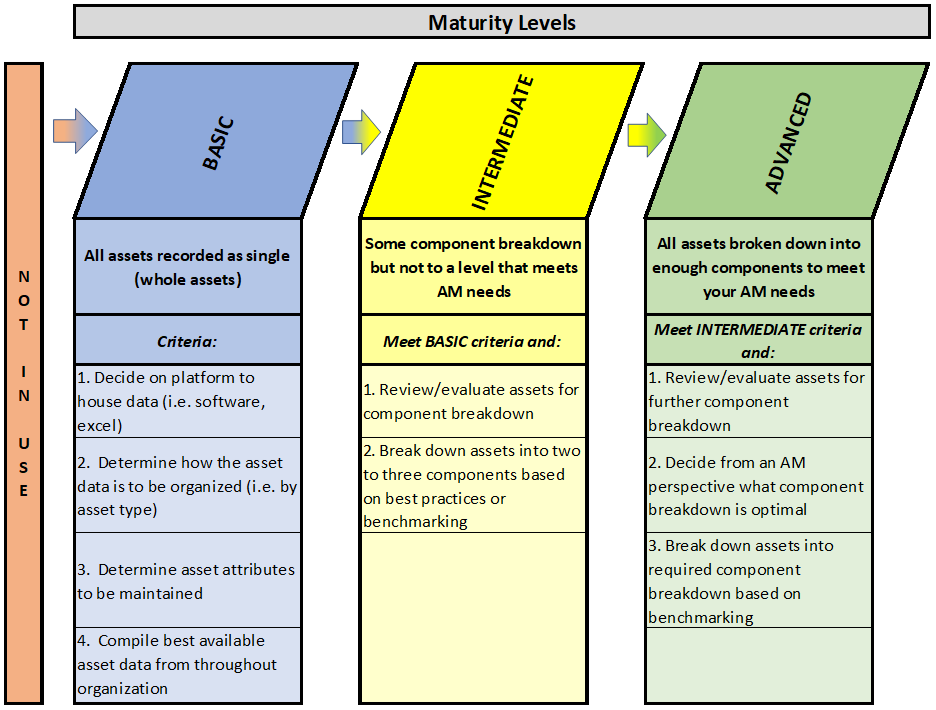
At the basic level of maturity, municipalities record all assets as single assets (whole assets). The steps to attain this level are: first, determine where the asset information will be housed; second, determine how the asset data will be organized within the asset register, and which asset attributes will be maintained; and third, gather the necessary information to populate the asset register from various sources within the organization.
At the intermediate level of maturity, some component breakdown is undertaken, but not to a level that meets all asset management needs. In order to move to the intermediate level, municipalities will need to review and evaluate their assets to determine which types or categories should be broken down into components (focusing on more complex assets such as buildings and roads). At this level, it would be expected that these assets may be broken down into some components, based on best practices or benchmarking. Once components are created, they are treated as individual assets that relate to the overall whole asset.
At the advanced level of maturity, all assets are broken down into enough components to meet the municipality’s asset management needs. Again, a review and evaluation would be completed to identify assets for further breakdown. This evaluation would be undertaken from an asset management perspective to determine the optimal level of component breakdown for all assets.
The decision to break down an asset and maintain it at a component level will be based on the benefits this approach versus the cost to collect and maintain the data by the municipality. Complex assets (such as treatment plants, roads, and facilities) are often maintained at the component level to facilitate more accurate service delivery cost information. This occurs because major components have their own expected useful life that can be significantly different than the whole asset’s useful life. Similarly, the individual major components may also have significantly different useful lives from each other. This difference in components’ useful lives may then require replacement at different intervals during the life of the overall complex asset. By separately maintaining component data, important attributes such as replacement cost, risk/criticality, condition, and functionality/capacity can be tracked and made readily available for each component. Thus, a more accurate service delivery cost is developed with the use of components for certain assets.
The following tables provide examples of various assets being broken down into key components as well as examples of asset categorizations and classes.
Table 3‑10
Sample Asset Classes/Categories/Components – Roads
|
Parent Asset |
Classification |
Road Type |
Class* |
Ward |
Asset |
Component Asset |
|
Roads |
Urban |
Local |
Class 1 |
Ward 1 |
Road 1 |
Surface |
|
Class 2 |
Ward 2 |
Road 2 |
Base |
|||
|
Collector |
Class 3 |
Ward 3 |
Road 3 |
Curb |
||
|
Rural |
Class 4 |
Ward 4 |
Road 4 |
Sidewalk |
||
|
Arterial |
Class 5 |
Ward 5 |
Road 5 |
Guard Rails |
||
|
Class 6 |
Ward 6 |
Road 6 |
Streetlights |
|||
|
* Minimum Maintenance Standards |
||||||
Table 3‑11
Sample Asset Classes/Categories/Components – Bridges
|
Parent Asset |
Classification |
Road Type |
Class* |
Ward |
Asset |
Component Asset |
|
Bridges |
Urban |
Local |
Class 1 |
Ward 1 |
Bridge 1 |
Surface |
|
Class 2 |
Ward 2 |
Bridge 2 |
||||
|
Collector |
Class 3 |
Ward 3 |
Bridge 3 |
Deck |
||
|
Rural |
Class 4 |
Ward 4 |
Bridge 4 |
Structure |
||
|
Arterial |
Class 5 |
Ward 5 |
Bridge 5 |
Rails |
||
|
Class 6 |
Ward 6 |
Bridge 6 |
* Minimum Maintenance Standards
Table 3‑12
Sample Asset Classes/Categories/Components – Buildings
|
Parent Asset |
Department |
Service |
Ward |
Asset |
Uniformat Level 1 |
Uniformat Level 2 |
|
Buildings |
Dept. 1 |
Service A |
Ward 1 |
Building 1 |
Substructure |
Foundations |
|
Basement Constr’n |
||||||
|
Ward 2 |
Shell |
Superstructure |
||||
|
Building 2 |
Exterior Enclosure |
|||||
|
Ward 3 |
Roofing |
|||||
|
Service B |
Interiors |
Interior Constr’n |
||||
|
Ward 4 |
Building 3 |
Stairs |
||||
|
Interior Finishes |
||||||
|
Ward 5 |
Services |
Conveying |
||||
|
Dept. 2 |
Service C |
Building 4 |
Plumbing |
|||
|
Ward 6 |
HVAC |
|||||
|
Fire Protection |
||||||
|
Ward 7 |
Building 5 |
Electrical |
||||
|
Service D |
Equipment and Furnishings |
Equipment |
||||
|
Ward 8 |
Furnishings |
|||||
|
Building 6 |
Special Constr’n / Demo. |
Special Constr’n |
||||
|
Ward 9 |
Selective Building Demolition |
Table 3‑13
Sample Asset Classes/Categories/Components – Water/Wastewater Facilities
|
Parent Asset |
Classification |
Ward |
Asset |
Component Asset |
|
Water and Wastewater Buildings |
Water |
Ward 1 |
Building 1 |
Process Equipment |
|
Process Electrical |
||||
|
Ward 2 |
Building 2 |
Process Instrumentation |
||
|
Ward 3 |
Process Piping |
|||
|
Wastewater |
Ward 4 |
Building 3 |
Building and Process Structural |
|
|
Ward 5 |
Building 4 |
Building Architectural |
||
|
Ward 6 |
Building Services |
Table 3‑14
Sample Asset Classes/Categories/Components – Environmental Linear Assets
|
Parent Asset |
Classification |
Ward |
Main ID |
Component Asset |
|
Water, Wastewater, and Stormwater Linear Assets |
Water |
Ward 1 |
Main 1 |
Main |
|
Ward 2 |
Main 2 |
|||
|
Wastewater |
Ward 3 |
Main 3 |
Service Connection |
|
|
Ward 4 |
Main 4 |
|||
|
Stormwater |
Ward 5 |
Main 5 |
Manholes |
|
|
Ward 6 |
Main 6 |
Table 3‑15
Sample Asset Classes/Categories/Components – Solid Waste
|
Parent Asset |
Ward |
Address |
Component Asset |
|
Solid Waste |
Ward 1 |
Address 1 |
Collection Vehicles |
|
Ward 2 |
Address 2 |
||
|
Ward 3 |
Address 3 |
Scales |
|
|
Ward 4 |
Address 4 |
||
|
Ward 5 |
Address 5 |
Sorting Equipment |
|
|
Ward 6 |
Address 6 |
Table 3‑16
Sample Asset Classes/Categories/Components – Vehicles/Machinery/Equipment
|
Parent Asset |
Classification |
Ward |
Address |
Component Asset |
|
Vehicles, Machinery, and Equipment |
Roads |
Ward 1 |
Address 1 |
Main Vehicle/Mach., Equipment |
|
Ward 2 |
Address 2 |
|||
|
Fire |
Ward 3 |
Address 3 |
Motor |
|
|
Ward 4 |
Address 4 |
|||
|
Parks |
Ward 5 |
Address 5 |
Detachable Components |
|
|
Ward 6 |
Address 6 |
Table 3‑17
Sample Asset Classes/Categories/Components – Land Improvements
|
Parent Asset |
Classification |
Ward |
Address |
Component Asset |
|
Land Improvements |
Roads |
Ward 1 |
Address 1 |
Parking Lots: Surface, Base |
|
Ward 2 |
Address 2 |
|||
|
Fire |
Ward 3 |
Address 3 |
Playground Structure: By Piece of Equipment |
|
|
Ward 4 |
Address 4 |
|||
|
Parks |
Ward 5 |
Address 5 |
Fencing: Use of Fence “Segments” |
|
|
Ward 6 |
Address 6 |
It is important to note, however, that there may be other opportunities to break down a whole asset into its components. Each municipality must assess its asset-related needs, and make appropriate determinations based on how the assets are actually operated and maintained. In general, it would be advantageous to organize an asset’s data into components when:
· The components of a single whole asset have significantly different useful lives from each other;
· The assets are operated and maintained more at a component level;
· Asset condition differs from one component to another; and
· The cost or risk of failure of the components is significant enough to warrant separate tracking.
How are your assets broken down into segments (i.e. Roads, Water, Storm, Wastewater)?
The optimal level of linear asset segmentation is another factor to consider when determining the appropriate level of asset detail (i.e. for roads, water mains, wastewater mains and storm mains). Determining the level of segmentation is a process that is somewhat similar to determining the level of asset component breakdown. Both require a cost/benefit analysis to determine what makes sense for each specific municipality.
How are your assets broken down into segments (i.e. Roads, Water, Storm, Wastewater)?
At the basic level of maturity, municipalities record all assets as single assets (whole assets) or through some type of pooling approach. An example would include pooling roads by year of construction. The steps to attain this level are:
1. Determine where the asset information will be housed;
2. Determine how the asset data will be organized within the asset register; and
3. Ascertain which asset attributes will be maintained.
From this point, the municipality will be in a position to gather the necessary information from various sources within the organization.
At the intermediate level of maturity, some segmentation is undertaken but not to a level that meets asset management needs. Asset pooling would be minimal for linear assets. To successfully advance to the intermediate level, municipalities will first need to review and evaluate their assets to determine which should be broken down into segments. At this level, it is expected that assets may be broken down into segments based on general location (i.e. by street name) and by age (year of construction).
At the advanced level of maturity, all assets are broken down into enough segments to meet asset management needs. A review and evaluation should be completed to identify assets for further segmentation. This evaluation is undertaken from an asset management perspective to determine the optimal level of segmentation (i.e. intersection to intersection, or GIS node to node). At the advanced level of maturity, municipalities may make use of shorter and clearly identifiable segments.
The collection of data for linear or network-related assets such as roads, water, wastewater, and stormwater systems will typically include length, unit of measure and location (start and end points). This information provides the opportunity to identify and track network assets based on logically determined “segments”. The determination of the basis for segmentation will hinge upon how the municipality’s data is arranged. Common examples of asset segmentation include:
· By intersection;
· By length (i.e. every 500 meters);
· By GIS node; and/or
· By age/condition (Since different segments of linear assets are constructed, or replaced at different times, it is usually advantageous to track these segments separately).
By using a segmentation approach, a municipality will have a more accurate and detailed breakdown of network or linear related assets. The advantages of using segments includes the ability to document betterments and replacements more accurately (i.e. limit the instances where segments are partial replaced or improved). However, there are disadvantages related to the need to maintain more assets within the asset register.
Once again, the municipality must consider its asset management needs when deciding whether to apply segmentation to a linear asset category. As discussed earlier, the municipality should attempt to break down its assets based on how they are operated and maintained.
How is replacement cost determined?
Asset costs are not only a requirement in asset record keeping, but also of great benefit to municipalities in asset management planning and other areas. Costs take many forms, including:
· Historical cost: The original cost to purchase or construct the asset, which is typically only used for accounting purposes; and
· Current cost: The cost of the asset in today’s dollars, which can represent:
o Reproduction cost: The current cost of the asset in place today; and
o Replacement cost: The current cost of the asset with which you intend to replace an existing asset.
Accurate costs assist asset managers with external reporting needs, as well as making long‑term asset management and financial management decisions. They provide an understanding of the asset investment level and allow staff to allocate costs and plan for maintenance, rehabilitation, and replacements.
How is replacement cost determined?
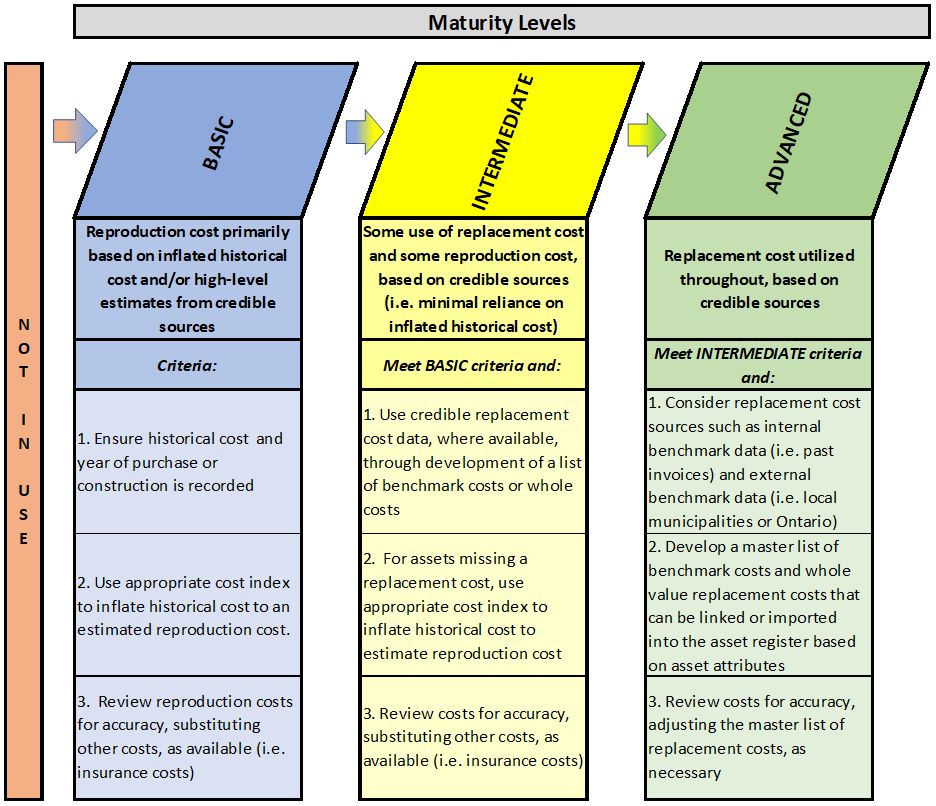
At the basic level of maturity, municipalities determine current cost by using reproduction cost estimates, based on inflating historical cost to current year cost using relevant inflation indices. To perform these calculations municipalities will first require, as a minimum, the historical cost of their assets and the year of acquisition/construction. Second, municipalities will require an appropriate cost index to be applied to inflate historical cost to current year costs. Statistics Canada maintains many historical cost indices that are relevant including CPI (for purchased assets such as equipment, machinery, vehicles, etc.) and NRCPI (for construction related assets such as roads, water, wastewater, facilities, etc.). It is recommended that the resulting reproduction costs are reviewed for accuracy with consideration given to substituting other available costs (i.e. engineering estimates, insurance), if deemed more appropriate.
At the intermediate level of maturity, municipalities make more use of replacement cost estimates for future cost purposes, and supplement replacement costs with reproduction cost (from credible sources) where necessary. Inflated historical cost use is minimized wherever possible. The use of credible sources for replacement cost, through the development of benchmark costs or whole asset cost estimates is undertaken. For assets with no available replacement cost information, reproduction cost estimates are used. It is recommended that resulting replacement/reproduction costs be reviewed for accuracy with consideration to substituting other available costs (i.e. engineering estimates, insurance), if deemed more appropriate.
At the advanced level of maturity, municipalities use replacement cost exclusively, based on credible and supportable sources. This requires the municipality to have in place a process to find and document replacement cost sources (i.e. internal sources, such as past tenders and invoices; and external sources, such as benchmark costs from comparable municipalities or the province). This master list of benchmark costs and whole value replacement costs should be linked to or imported into the asset register based on asset attributes (i.e. road length or road square metres). It is recommended that the resulting replacement costs be reviewed to ensure an appropriate level of accuracy.
PSAB 3150 states that the historical cost of an asset should include “all costs directly attributable to the acquisition, construction or development of the tangible capital asset. This includes installing the asset at the location and in the condition necessary for its intended use. Examples of directly attributable costs include:
· Asset purchase or construction;
· Site preparation costs;
· Initial delivery and handling costs;
· Installation and assembly costs;
· Costs of testing that the asset is functioning properly prior to, or during, installation;
· Professional fees (e.g. design, legal, etc.); and
· Other (e.g. service continuity costs).
The term “directly attributable” is the key to determining whether a cost can be allocated to a tangible capital asset” from a historical cost perspective. While this term is related to determining the historical cost of an asset, the same guideline can be applied in determining the asset’s current cost for asset management purposes. If a municipality only includes an asset’s purchase or construction cost in the determination of current cost the cost will be underestimated, as it is ignoring the other costs that are directly attributable to making the asset “service ready”. Therefore, when determining current cost, a municipality should be mindful of all costs involved in getting the asset ready to be used and put into service.
There are a number of methods available to determine the current cost of a capital asset. Current valuation for different capital assets may require varied approaches depending on availability of costing information, and complexity of the calculation itself. The use of benchmarking costs can be very useful in this regard. Benchmarking costs can be internally calculated, or retrieved from external sources such as neighbouring municipalities, industry publications/experts, online searches, and buyers’ guides. The following are various methods of determining current cost:
· Inflated historical cost: The historical cost of an asset, as used for PSAB 3150 purposes, inflated to current year dollars using some type of construction or consumer price index (i.e. from Stats Can or MFOA);
· Insured cost: The current cost of an asset as identified by insurance appraisal;
· Reproduction cost: The cost of reproducing an asset in substantially identical form, often referred to as like-for-like, since it does not attempt to take into account impacts on costs such as changes in technology or construction methods; and
· Replacement cost: The cost of the asset intended to replace an existing asset. It attempts to take into account changes in technology, as well as the municipality’s expected levels of service.
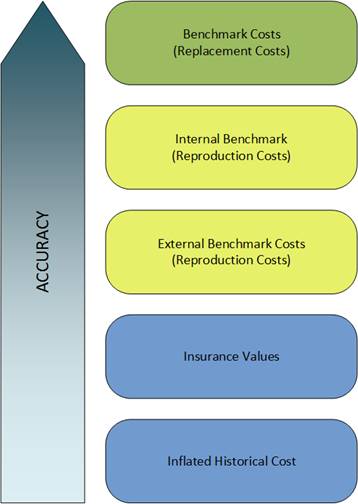
The methods of determining current cost described above vary in terms of complexity and level of accuracy. In determining a reproduction or replacement cost, source costs or benchmark costs can be derived from external sources (i.e. other municipalities or provincial averages) or from internal sources (i.e. recent tender pricing). The following list of approaches is presented in order of accuracy for determining current valuation:
1. Replacement Cost – Internal Benchmark Cost: This method is most accurate since it relates to the cost of the asset being purchased or constructed, and it takes into account any specific local cost factors for the municipality. A good source of information for internal benchmark costs would be from recent tender results or capital project progress payments.
2. Replacement Cost – External Benchmark Cost: This method provides the cost of the asset being purchased or constructed but will not necessarily consider specific cost factors existing for the municipality.
3. Reproduction Cost – Internal Benchmark Cost: This method will provide a cost to reproduce the existing asset in its current form, taking into account any specific local cost factors for the municipality.
4. Reproduction Cost – External Benchmark Cost: This method will provide a cost to reproduce the existing asset in its current form, but will not necessarily consider specific cost factors existing for the municipality.
5. Insurance Cost: Replacement costs for insurance purposes are estimates based on factors and inputs that may be quite different than those required for asset management costing purposes. Again, caution should be exercised before considering this method of current valuation.
6. Inflated Historical Cost: This method can be easier to perform, but caution is advised when considering the result. Current valuation, undertaken in this manner, is predicated on many assumptions used when determining historical cost, and also relies on inflationary cost indexes as being accurate. For example, assets purchased in the past may have completely different attributes than currently available comparable assets or may have been constructed using methods/materials that have undergone significant change over the years. In addition, there are numerous available rates of inflation that could be applied in the calculation, and the alternative applications will impact on the final result.
Figure 3‑2
Accuracy of Asset Costing Methods
Some examples of benchmark costs are shown in the table below:
Table 3‑18
Sample Benchmark Costing Methods
|
Benchmark Costs |
||
|
Service Area |
Asset Type |
Examples |
|
Roads |
Roads |
$/Linear Metre |
|
$/m2 |
||
|
Bridges |
Bridges |
$/Bridge Type per Span |
|
Stormwater |
Stormwater Main |
$/m by Diameter |
|
Solid Waste |
Landfill |
$/Item by Type |
|
Water |
Water Main |
$/m by Diameter |
|
Wastewater |
Wastewater Main |
$/m by Diameter |
|
Buildings |
Buildings |
$/ft2 |
|
Equipment and Vehicles |
Equipment and Vehicles |
$/Item by Type |
|
Land Improvements |
Fencing |
$/m |
|
Land Improvements |
$/Item by Type |
|
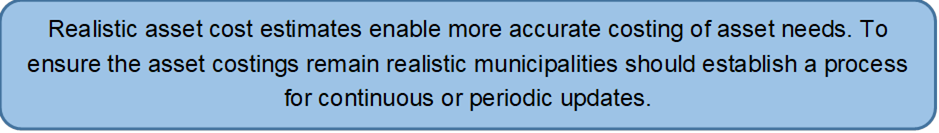
Do you have documentation in place to determine when and how current values (i.e. replacement costs) are updated?
As noted in the previous section, there are a number of alternative methods to determine replacement costs. Once replacement costs have been initially determined, a process should be put into place to update replacement costs on a regular basis. New or better information can come to light that can significantly affect currently recorded replacement costs. In addition, inflation can play a role in valuation adjustments. Since replacement costs can come from various sources, documentation of the frequency and recommended sources of replacement costs should be created and put in place.
Do you have documentation in place to determine when and how current values (i.e. replacement costs) are updated?
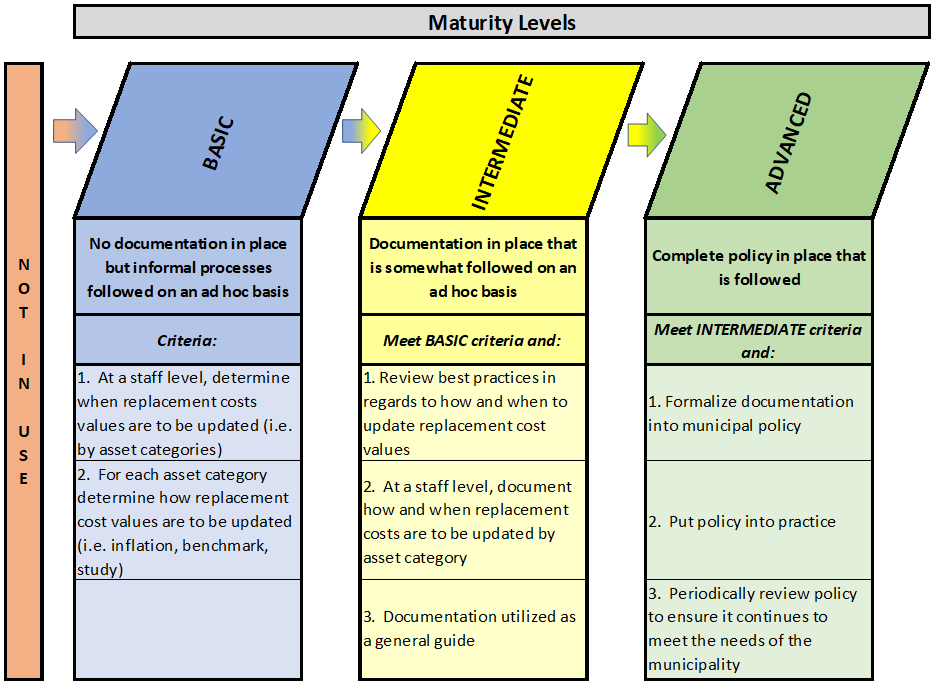
At the basic level of maturity, municipalities may have no documentation in place to outline the cost process. Instead, costing is undertaken in an informal way, typically on an ad hoc basis. At a staff level, it would be determined when current costs would be updated (i.e. by asset category), and by what methodology.
At the intermediate level of maturity, municipalities have a costing process documented and in place, however it may only be followed on an ad hoc basis. It is recommended that when putting a process in place, municipalities review best practices and applicable legislation related to the timing and methodologies of asset valuation. This provides an opportunity for staff to prepare the valuation process with best practices and legislative requirements in mind. However, at the intermediate level of maturity, the documentation, once completed, may not be fully used as intended.
At the advanced level of maturity, a complete costing policy will be put in place and be followed consistently by staff. This requires municipalities to formalize the costing process into a policy with appropriate approval processes. The policy is put into practice with periodic reviews to ensure it is still meeting the needs of the municipality.
Updating estimates of future costs can be completed using different methodologies and at different time intervals. For example, a municipality may perform a formal update of benchmarking costs for an asset type once every five years. In the intervening years, using appropriate construction or consumer related inflationary adjustments can be considered (see table below). A municipality may also decide to undertake formal updates on current costs on a more frequent basis for high risk/critical assets, or for assets with legislated requirements to perform assessments on a more frequent basis (i.e. bridges).
Table 3‑19
Sample Timeline for Updating Benchmark Costs
|
Year |
|||||
|
0 |
1 |
2 |
3 |
4 |
5 |
|
Benchmarking Costs Updated |
Inflationary Factor Applied |
Inflationary Factor Applied |
Inflationary Factor Applied |
Inflationary Factor Applied |
Benchmarking Costs Updated |
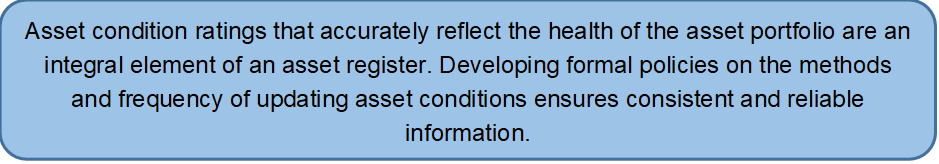
What sources of information are used to assess asset condition?
The physical state or health of an asset is defined by its condition rating. Condition measures provide information about where an asset is in its overall life cycle. Condition ratings are also considered a more accurate attribute to be used in making asset decisions, in comparison to an age-based approach.
Asset condition is measured in order to:
· Identify and plan for treatments that maximize asset life, avoid unplanned failures, and maintain service levels;
· Be able to assess the remaining useful life of an asset;
· Enable long-term financial planning based on asset deterioration and renewal needs; and
· To comply with statutory and regulatory requirements (where applicable).
What sources of information are used to assess asset condition?
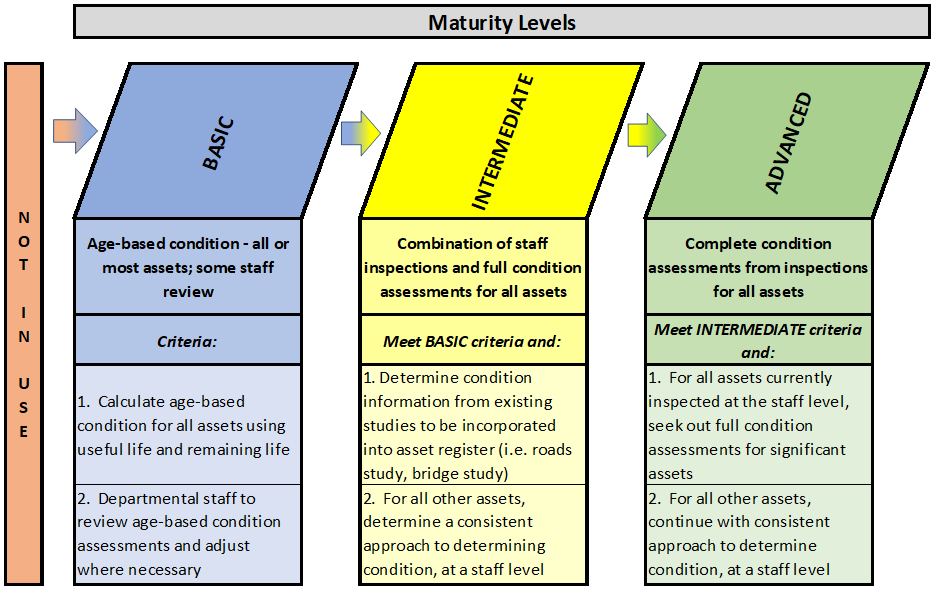
At the basic level of maturity, municipalities rely on age-based condition ratings for all or most assets, although some adjustments are expected based on staff review. This process includes the calculation of each asset’s remaining useful life and how the result compares to that asset’s total useful life. This relationship would drive the determination of each particular asset’s condition rating. For example, an asset at the end of its life would have a condition rating of ‘poor’, or 0/5 or 0/10, whereas an asset at the beginning of its life would have a condition rating of ‘very good’ or 5/5 or 10/10. Staff could review the resulting condition assessments and adjust, where necessary, based on asset knowledge.
At the intermediate level of maturity, municipalities engage in a combination of staff inspections and full condition assessments for all assets. Condition information would be sourced from existing studies (i.e. roads studies, bridge studies, etc.) and incorporated into the asset register. For other assets, staff would follow a consistent approach to determining condition based on visual or full inspections.
At the advanced level of maturity, complete condition assessments by inspection of all assets are undertaken. This entails the use of full condition assessments for all significant assets with staff following a consistent approach to determine condition for the remaining assets.
There are different approaches to assessing the condition of assets. Also, there are different factors to consider when choosing a condition assessment method for each asset type.
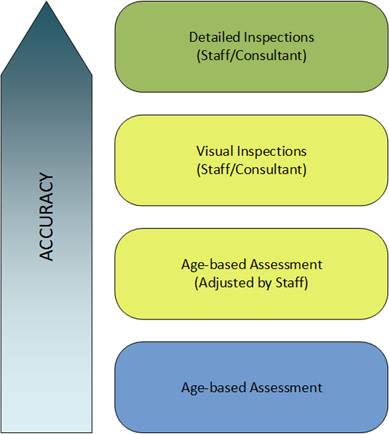
Generally, condition assessment methods fall under the following headings:
1. Age-Based: Using the asset’s age in relation to useful life, make an estimation of where the asset is in its life cycle. This method provides a similar result to an age‑based asset analysis.
Example: An asset has a useful life of 60 years, and is 50 years old. The age based condition rating is: (60 – 50) / 60 = 17% of maximum condition (i.e. 1.7/10)
2. Age-Based with Adjustments by Staff: Similar to age-based assessments, however, the municipality’s staff would review the results and make amendments where deemed appropriate.
Example: An asset has a useful life of 60 years, and is 50 years old. The age‑based condition rating is: (60 – 50) / 60 = 17% of max condition (i.e. 1.7/10). Public Works staff have decided to adjust the condition score from 1.7 to 5.0 due to their knowledge of the asset and how it has been maintained. This may result in delaying scheduled replacement by several years.
3. Visual Inspection: This can be undertaken by municipal staff or consultant. A visual inspection of each asset is used to determine an overall condition rating.
4. Detailed Inspection: Again, this can be undertaken by municipal staff or consultant, and standard engineering practices should be applied. The inspection moves beyond visual, and includes other factors such as functionality and testing.
The following diagram outlines how the level of condition assessment accuracy increases based on the type of assessment performed.
Figure 3‑3
Accuracy of Condition Assessment Methods
The method of condition assessment is often determined by asset type. For example, if the asset is easily accessible and identifiable, a visual inspection may often be an appropriate method of condition assessment. This may apply to assets such as road surface related assets, bridges, buildings, furniture and equipment. A visual assessment may also be completed using digital imaging. Road condition data is increasingly being assessed using digital imaging, with the condition assessed off-site using the images. Similar techniques are also used to inspect hard to access areas of large buildings and structures.
For assets that are difficult to inspect (e.g. buried assets such as water and wastewater mains), physical inspection may not be possible. In such cases, condition is often derived from the asset age, maintenance records, or CCTV inspections (if possible). A sample may be inspected and the results extrapolated to the remainder of the network. For assets such as road bases, frequently consultants will perform tests and drill bore holes into the base to determine condition. Past maintenance data, including repair/breakdown/deficiency data of assets being assessed can be taken into account, as well.
For some assets such as pumps and other machinery, constant
monitoring of factors such as pressure, temperature, and vibration will provide
continuous condition data. The following table provides some examples of asset
condition assessment factors:
Table 3‑20
Sample Asset Condition Assessment Factors
|
Condition Description |
||
|
Roads |
Cracking – Linear, Transverse, Pattern Rutting Roughness (Ride) Surface Texture – Flushing and Stripping Asphalt Ravelling Bitumen Oxidisation Deformation Skid Resistance Deflection (Strength) Joint Spalling (Concrete) Joint Stepping (Concrete) |
|
|
Sidewalks |
Trips (Steps) Cracking |
|
|
Curbs |
Cracking Displacement (Vertical) Displacement (Horizontal) Rotation |
|
|
Bridges and Major Culverts
|
Deck |
Cracking Expansion Joint Displacement Deformation |
|
Superstructure and Substructure |
Cracking Spalling Corrosion Deformation |
|
|
Abutments/End Walls |
Cracking Spalling Erosion (Undercutting) Corrosion |
|
|
Railings/Handrails and Barriers |
Cracking Spalling Deformation Accident Damage |
|
Condition ratings can follow any
scale and can be either quantitative or qualitative. Regardless of the
condition rating scale used, it is recommended that municipalities remain
consistent with that scale over all asset categories. Table 3-21 (below)
provides some examples:
Table 3‑21
Sample Condition Rating Scales
|
Quantitative Condition Scale |
Qualitative Condition Scale |
|
0 to 3 Scale 0 to 5 Scale 0 to 10 Scale 0 to 100 Scale |
Poor, Average, Good (Equivalent to a 0 to 3 Scale). Very Poor, Poor, Average, Good, Very Good (Equivalent to a 0 to 5 Scale). |
Actual condition data can take many forms, although as a general rule it is expressed in terms of:
· Severity: Measures how good/bad the asset condition is; and
· Extent: Measures how much of a particular distress or defect there is.
Some examples of condition measures commonly used for assets are shown below.
A basic condition rating scale:
Table 3‑22
Sample Qualitative Condition Rating Scale
|
Rating |
Condition Description |
|
Poor |
The asset exhibits obvious signs of deterioration and should either be monitored more closely or some form of intervention undertaken to improve the condition. The risk of failure is higher. |
|
Fair |
The asset is showing some signs of deterioration and may therefore require more attention but is still a moderate to low risk of failure. |
|
Good |
The asset shows little, if any, sign of deteriorations and should only require basic maintenance and upkeep. Very low risk of failure. |
This scale is suitable for simple assets with low criticality. It is relatively easy to define and assess condition.
A slightly more detailed numeric scale based on severity of visible attributes:
Table 3‑23
Sample Qualitative Condition Rating Scale – Severity
|
Rating |
Condition Description |
|
0 |
Asset Unserviceable |
|
1 |
Renewal Required |
|
2 |
Maintenance Required |
|
3 |
Minor Defects Only |
|
4 |
Very Good Condition |
|
5 |
Brand New |
Similar to above, this scale is suitable for simple assets with low criticality. It is relatively easy to define and assess condition.
A numeric scale based on “extent”:
Table 3‑24
Sample Quantitative Condition Rating Scale – Extent
|
Rating |
Condition Description |
|
0 |
Cracking affecting > 40% of the Asset |
|
1 |
Defect affecting between 20% and 40% of the Asset |
|
2 |
Defect affecting between 10% and 20% of the Asset |
|
3 |
Defect affecting between 5% and 10% of the Asset |
|
4 |
Defect affecting < 5% of the Asset (length, area) |
|
5 |
No Defect |
This scale is suitable for simple or complex/linear assets, provides a reasonably simple method of assessment, and provides reasonable indication of treatment needs.
A numeric scale can also be associated with a severity scale such as the one below for cracking:
Table 3‑25
Sample Quantitative Condition Rating Scale – Severity
|
Severity |
Severity Description |
|
Severe (X) |
Cracks > 5mm |
|
Moderate (M) |
Cracks > 2mm < 5mm |
|
Slight (S) |
Cracks < 2mm |
This approach results in a matrix as shown in the following table:
Table 3‑26
Sample Severity/Extent Matrix
|
Extent 0 |
Extent 1 |
Extent 2 |
Extent 3 |
Extent 4 |
Extent 5 |
|
|
Severe (X) |
|
X1 |
X2 |
X3 |
X4 |
X5 |
|
Moderate (M) |
|
M1 |
M2 |
M3 |
M4 |
M5 |
|
Slight (S) |
0 |
S1 |
S2 |
S3 |
S4 |
S5 |
Another combination of severity and extent is often used for all assets, in this case the percentage of the asset in each condition state for the numerical scale is reported:
Table 3‑27
Sample Condition Rating Scale
|
%Condition 1 |
%Condition 2 |
%Condition 3 |
%Condition 4 |
%Condition 5 |
Total Condition |
|
10% |
15% |
20% |
35% |
20% |
100% |
This table provides a good indication of the extent of remedial work required as well as combining to provide overall condition. This can also be used in the municipality’s levels of service analysis (see Chapter 4).
Regardless of the type of condition information collected or which method of capture is used, it is essential to have an understanding of the accuracy of the data and its reliability/consistency. Different personnel (staff or consultants) may assess the condition of assets differently, even after training and using a standard method. For example, if three different consulting companies assessed the condition of a road, you could potentially receive 3 different rating approaches that cannot be compared to each other. Processes and approaches to determine condition ratings should be put in place to ensure a somewhat consistent approach that should be much less open to interpretation.
Prior to commencing the condition assessments, it is important to develop a strategy which outlines not only the approach, but also the timing and frequency to be used with completing condition assessments. Consideration should be given to:
· Assessment approach:
o Identify how much useful life has been consumed;
o Identify a condition (or multiple condition ratings) where some intervention is required to ensure the asset meets service standards (i.e. renewal, rehabilitation or maintenance); and
o Indicate if the asset is in danger of service or physical failure.
· Use of condition information;
· Condition assessment collection options; and
· Costs and limitations of each method.
Do you have documentation in place to determine when and how condition assessments are updated?
Condition assessments should be updated on a regular basis. In order to facilitate the planning of condition assessment updates, it is advisable to document the frequency and recommended methods for doing so.
Do you have documentation in place to determine when and how condition assessments are updated?
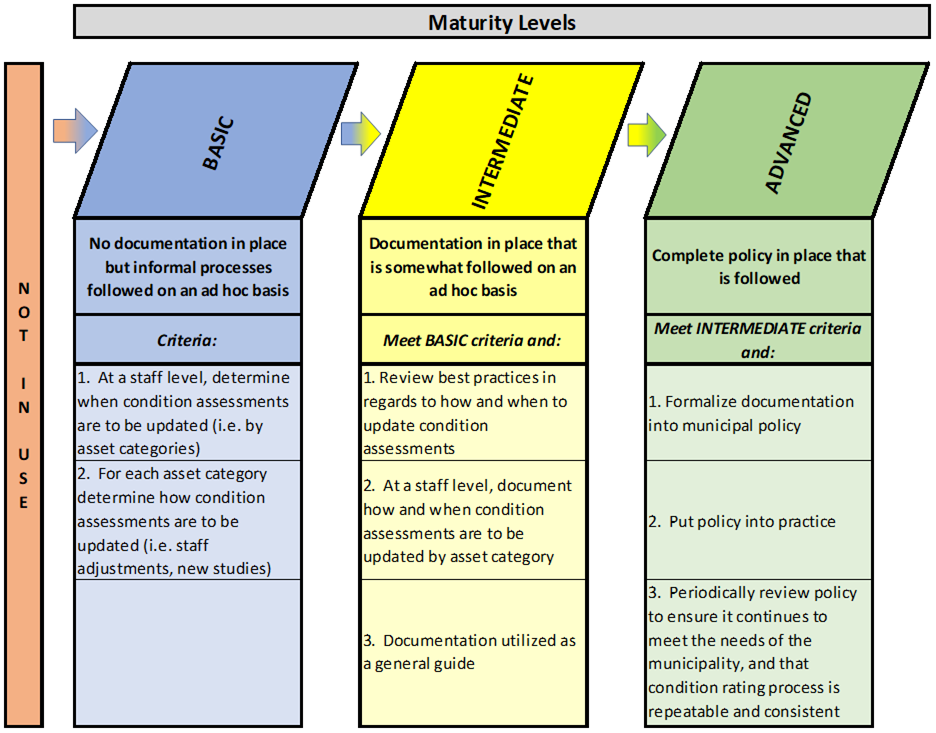
At the basic level of maturity, municipalities may not have any documentation in place related to condition assessment processes. Rather, the condition assessment might be undertaken in an informal way, on an ad hoc basis, as needed. At a staff level, it might be determined when condition assessments would be updated (i.e. by asset category), as well as the methodology to be used.
At the intermediate level of maturity, municipalities have a documented process in place, but it may only be followed on an ad hoc basis. It is recommended that municipalities review best practices related to the timing and methodologies of condition assessments when putting documentation into place. Legislative requirements should also be consulted. Staff should prepare the documentation with best practices and legislative requirements in mind. However, at the intermediate level of maturity, the documentation, once completed, may not be fully used as intended.
At the advanced level of maturity, a complete condition assessment policy is put in place, and is followed by staff. This requires municipalities to formalize condition assessment documentation into a policy with appropriate approval processes. The policy in place should undergo periodic reviews to ensure it is still meeting the needs of the municipality.
Condition assessments should be kept up to date within the asset register. The municipality will need to determine the desired level of detail to be tracked and frequency at which these assessments should take place. One approach is to hire a qualified consultant to undertake a formal condition assessment periodically (i.e. every 5 years) with staff performing assessments (i.e. visual inspections or adjustments) in the intervening years (see table below). This approach allows for more minor adjustments to condition assessments, with condition “resets” occurring on a frequent basis.
Table 3‑28
Sample Timeline for Updating Condition Assessment
|
Year |
|||||
|
0 |
1 |
2 |
3 |
4 |
5 |
|
Assessment by Qualified Consultant |
Assessment Reviewed by Staff |
Assessment Reviewed by Staff |
Assessment Reviewed by Staff |
Assessment Reviewed by Staff |
Assessment by Qualified Consultant |
To what extent are the condition assessments impacted by historical maintenance (i.e. repair/breakdown/deficiency) data?
Historical maintenance data is important to factor in when assessing asset condition. Historical maintenance includes any repairs, breakdowns or deficiencies. This data is especially useful for assets where assessing condition is a challenge, such as watermains.
To what extent are the condition assessments impacted by historical maintenance (i.e. repair/breakdown/deficiency) data?
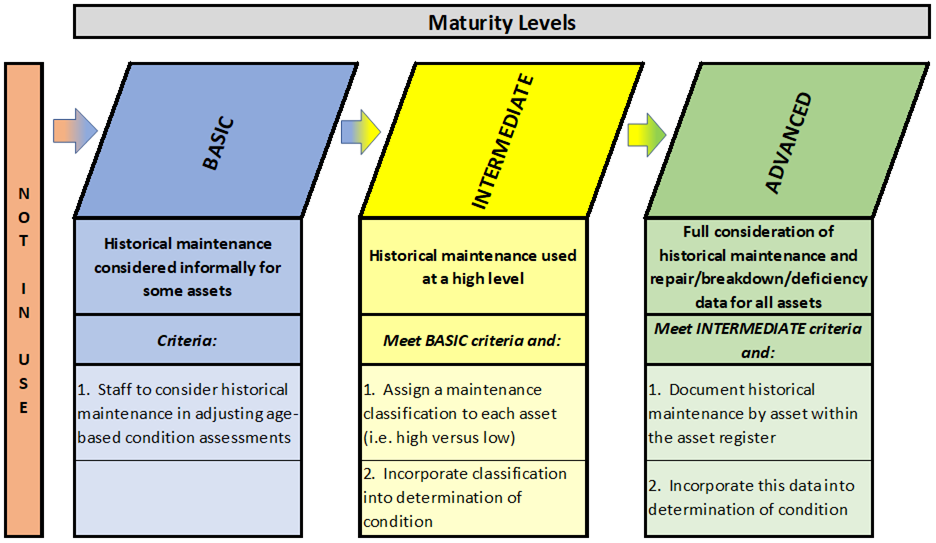
At the basic level of maturity, municipalities informally consider historical maintenance for some assets. This would likely occur informally as staff reviewed age-based condition assessments (based on knowledge and professional judgement).
At the intermediate level of maturity, a more formal process may be in place but at a high level. For example, a maintenance classification may be assigned to each asset, such as ‘high’ versus ‘low’. This classification would be considered in the determination of each asset’s condition assessment.
At the advanced level of maturity, municipalities give full consideration of historical maintenance, repairs, breakdowns, and deficiencies in determining asset conditions. This will require the documentation of these events for each asset within the asset register. The impact of this data would then be part of the condition assessment process, through standard engineering practices.
Is there a process in place that ensures repeatability and consistency of condition ratings?
Background
The ability to make accurate decisions based on asset condition ratings is very much based on the accuracy of the condition ratings themselves. This can be difficult, with staff turnover within the municipality and within the consulting firms that may assist in conducting the condition assessments. In addition, a municipality may hire different consulting firms from one year to the next, based on a tender/proposal award process.
With different people conducting condition assessments over time for a municipality, the ability to complete a “trending analysis” on asset condition is difficult unless these condition ratings are conducted using a consistent and repeatable approach. Without this documented approach, an asset with a condition rating of “7” based on one consultant’s calculations may not be consistent with a “7” for another consultant’s calculations.
Levels of Maturity
Is there a process in place that ensures repeatability and consistency of condition ratings?
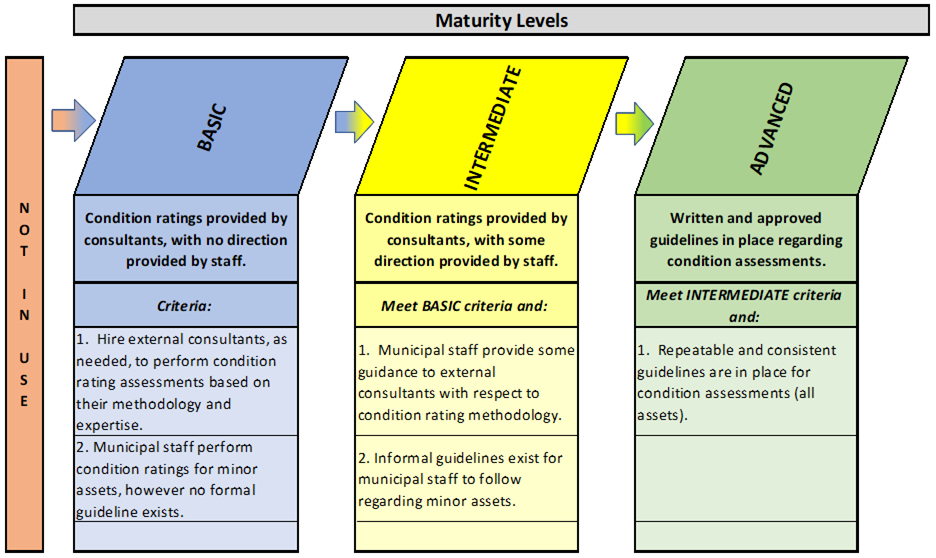
At the basic level of maturity, municipalities hire external consultants or have internal staff perform condition ratings, however how the condition ratings are determined is based on the professional expertise of the consultant/staff with no direction provided. Condition ratings are reviewed on a periodic basis with no formal process in place.
At the intermediate level of maturity, municipalities provide some direction to external consultants and/or internal staff members that are assisting with determining condition ratings. This can take the form of high-level direction or process regarding condition content or the methods used to determine condition ratings. This direction can be verbal or written and may not be followed on a regular basis.
At the advanced level of maturity, municipalities have written guidelines/procedures for calculating condition ratings for all assets. These guidelines ensure the repeatability and consistency of condition ratings, regardless of who is conducting them. The condition rating guidelines make up and approved component of the asset management planning process. Condition ratings are completed and verified to the guideline on a regular basis.
Consistency of Condition Ratings
For some assets, condition ratings can be legislated, such as the OSIM bridge inspections required every 2 years in Ontario. For other asset types, condition ratings may be more high level (i.e. vehicles). Regardless of the amount of effort or the level of detail required to conduct condition assessments, a consistent and repeatable methodology is needed. Documenting this methodology in a formal process ensures that consistency is maintained, even when staff turnover brings new employees into the condition assessment process.
Components of a consistent and repeatable condition assessment process:
· The assets being assessed as part of the methodology;
· The condition rating format (i.e. out of 5, 10 or 100);
· The calculation required to conduct the condition assessment (if applicable);
· Definition of variables and inputs within the calculation; and
· Definitions and examples of condition ratings, such as:
o “A 7 out of 10 is defined as…”
o “The following picture illustrates an asset with a condition rating of 7/10”.
Are the condition assessments performed at the asset component level (for assets with components)?
Since many assets will be broken down into components, consideration should be given to assessing condition at the component level versus at the whole asset level.
Are the condition assessments performed at the asset component level (for assets with components)?
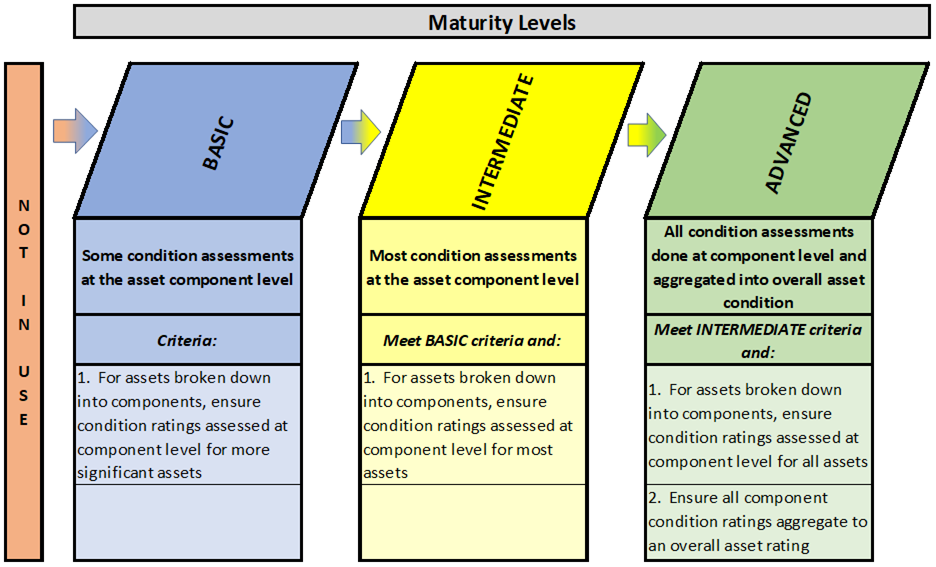
At the basic level of maturity, condition ratings are completed at the component level for significant assets, such as roads, bridges and facilities.
At the intermediate level of maturity, condition ratings are completed at the component level for most assets.
At the advanced level of maturity, condition ratings are completed at the component level for all assets where components are used. The component condition ratings would then be aggregated into an overall asset condition rating for the complex asset as a whole.
Is condition data used to determine remaining life and future lifecycle costs?
Background
As discussed in this chapter, condition rating data provides a more accurate approach to determining the remaining useful life of an asset, in comparison to using asset age and the asset’s estimated useful life. An asset can be half way through its anticipated useful life from an age perspective, however it has been maintained very well and has a “good” condition rating. Using condition ratings in the determinization of remaining useful life leads to a more accurate determination of future lifecycle costs required.
Levels of Maturity
Is condition data used to determine remaining life and future lifecycle costs?
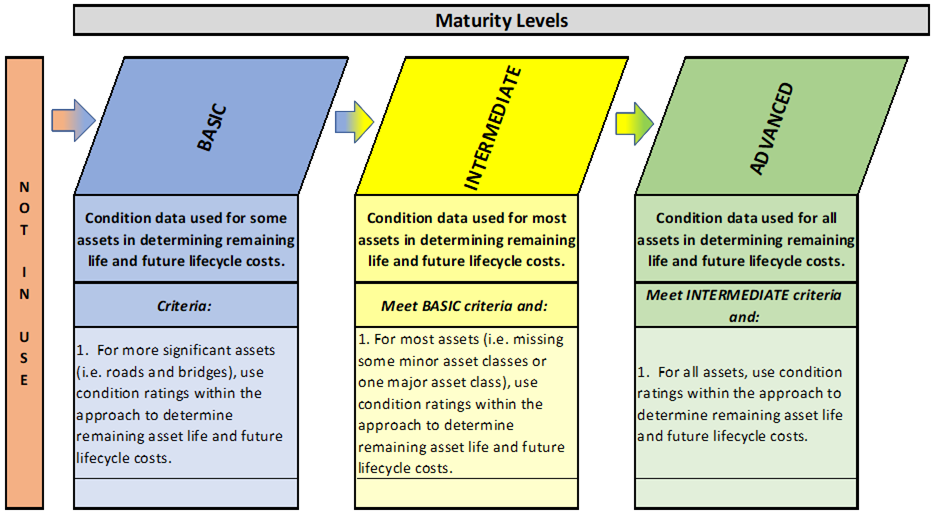
At the basic level of maturity, condition ratings are used for some assets (i.e. occasionally used) in determining remaining useful life and future lifecycle costs.
At the intermediate level of maturity, condition ratings are used for most assets (i.e. more moderately or frequently used) in determining remaining useful life and future lifecycle costs.
At the advanced level of maturity, condition ratings are used for all assets in determining remaining useful life and future lifecycle costs.
Using Condition Ratings to Make Decisions
Using condition ratings in the asset management process to determine asset remaining useful life and future lifecycle cost requirements can take many forms, depending on the complexity of the overall process, including:
· Using condition ratings in an asset database, for municipal staff to make decisions based on professional judgement;
· Using condition ratings in asset management spreadsheets, using formulas to make decisions; and
· Inputting condition ratings into asset management software to generate asset management related decisions and outcomes.
Is condition data used in the level of service analysis (i.e. benchmarking) from year to year?
Background
As discussed in chapter 4, an important tool in the levels of service analysis is the ability to do a trending analysis on metrics or performance measures. Condition is a metric that is commonly used in this area. Understanding if an asset’s condition rating is tracking towards or away from condition objectives provides useful information with respect to spending levels and the impact on service.
Levels of Maturity
Is condition data used in the level of service analysis (i.e. benchmarking) from year to year?
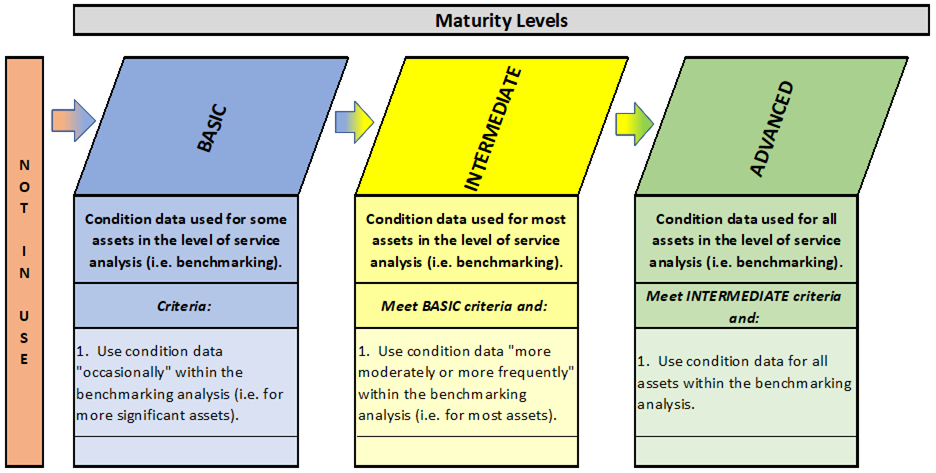
At the basic level of maturity, condition ratings are used for some assets (i.e. occasionally used) in determining service levels (i.e. benchmarking).
At the intermediate level of maturity, condition ratings are used for most assets (i.e. more moderately or frequently used) in determining service levels (i.e. benchmarking).
At the advanced level of maturity, condition ratings are used for all assets in determining service levels (i.e. benchmarking).
Condition Data and Levels of Service
Please refer to the discussion on performance measures and trending within Chapter 4.
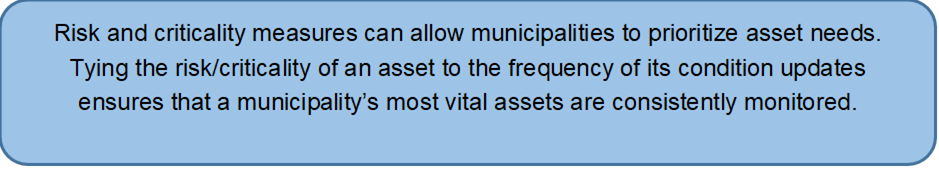
What method of risk/criticality assessment is used?
Risk management and optimized informed decision making are inherently linked. Identifying and acknowledging risks and managing them appropriately helps to mitigate the implications and consequence associated with such risks. This enables municipalities to make informed decisions around how to manage assets and their associated risk.
What method of risk/criticality assessment is used?
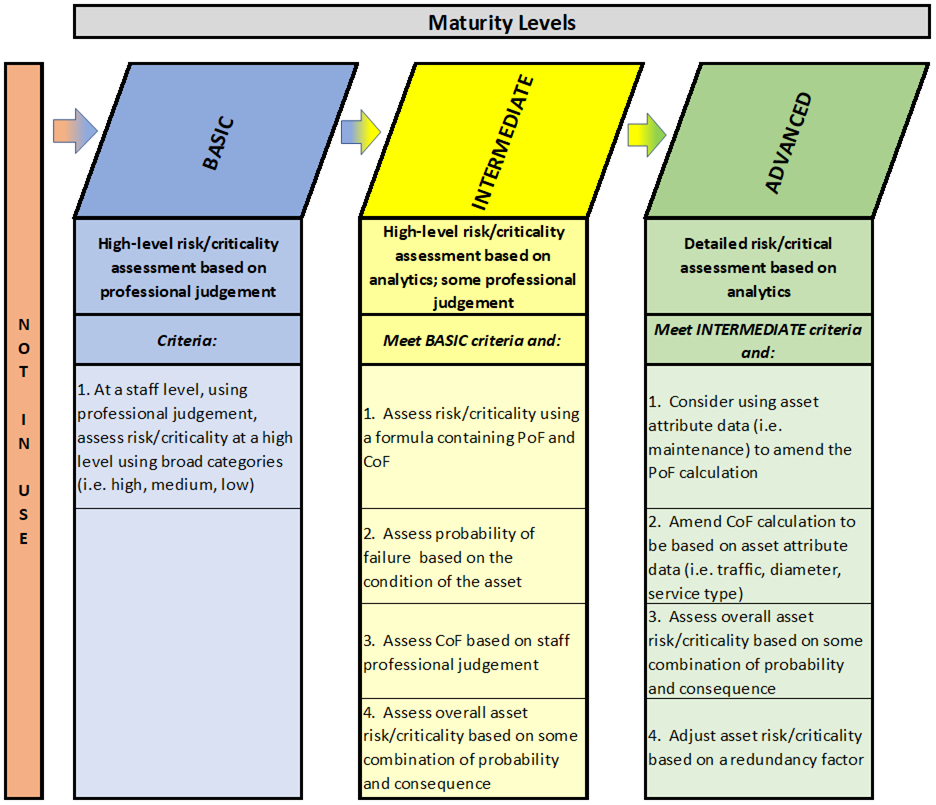
At the basic level of maturity, staff assess risk/criticality using their professional judgement. It would be typical at this level of maturity to see the use of broad categories for risk/criticality such as ‘high’, ‘medium’, and ‘low’ or using a numerical scale such as “0 to 3” or “0 to 5”.
At the intermediate level of maturity, it is expected to see the introduction of some risk/criticality assessments based on analytics, to supplement professional judgement. This would entail assessing risk using a formula based upon probability of failure (PoF) and consequence of failure (CoF). The assessment of PoF would be dependent upon, at a minimum, the condition of the asset, whereas CoF would be assessed based on staff’s professional judgement or some use of analytics. Overall risk/criticality can then be assessed based upon some combination of probability and consequence.
At the advanced level of maturity, a detailed risk/criticality assessment would be completed based upon analytics. This would include the use of asset attribute information to determine PoF and CoF. Overall risk/criticality can then be assessed based upon some combination of blending probability and consequence. Finally, consideration can be given to redundancy or other risk mitigation factors that may impact on the consequence assessment.
The risk or criticality calculation determines the overall risk of asset failure. Ideally, this calculation would be performed on all municipal assets consistently. If this is achieved, the risk/criticality analytic can become a documented approach to determining capital priorities. If applied consistently across all assets, a municipality can compare priorities across asset types (i.e. what is more important, a road or a park?).
A common risk/criticality formula is provided below:
Figure 3‑4
Example of Risk/Criticality Formula
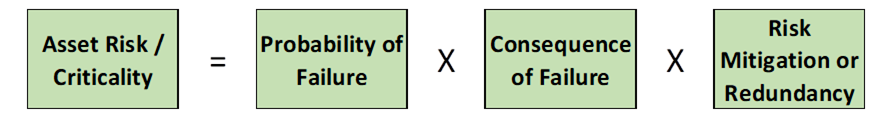
Probability of Failure (PoF): What is the chance that the asset will fail?
Consequence of Failure (CoF): What is the impact to the municipality if the asset does fail?
Risk Mitigation or Redundancy: Does the municipality have any risk mitigation procedures in place that reduce the overall risk or criticality rating for the asset? Examples:
· Maintenance or rehabilitation programs; and
· Backup or duplicate assets that can provide similar services (i.e. does the municipality have a fire truck that can act as a backup for another fire truck?).
The following diagram summarizes the risk/criticality calculation process:
Figure 3‑5
Risk/Criticality Calculation Process
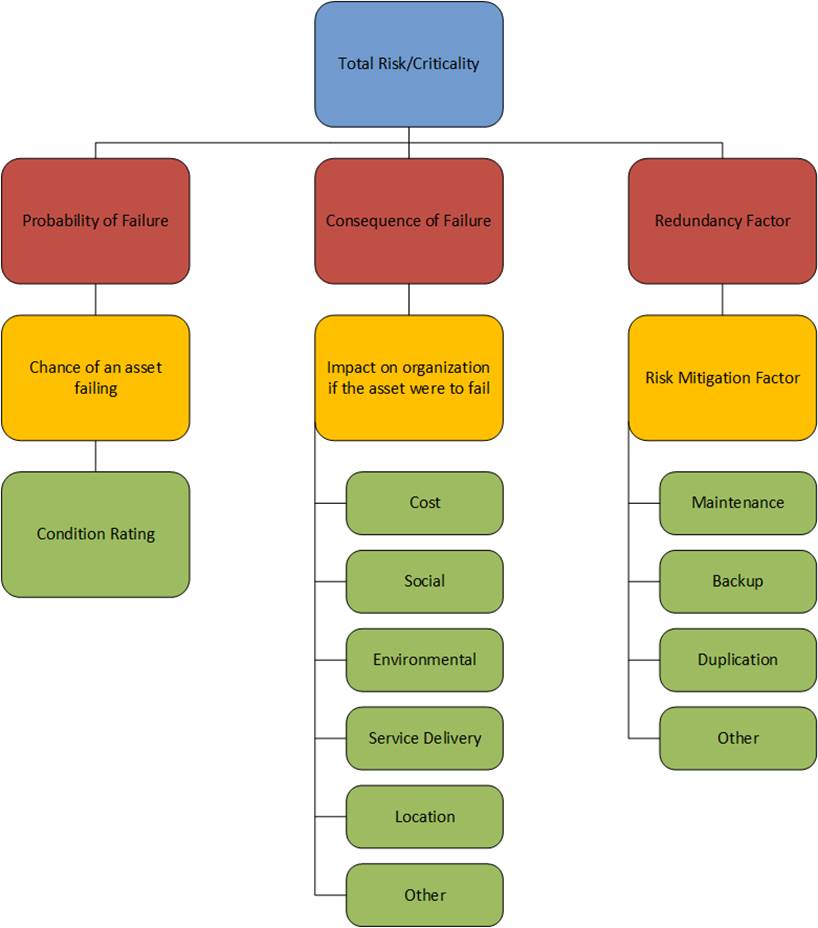
Probability of failure has commonly been linked to the condition assessment for each of the assets. For example, an asset with a condition rating of “Very Poor” would have an “Almost Certain” probability of failure, while an asset with a condition rating of “Very Good” would have a “Rare” probability of failure. Please refer to the following table for an example, both in quantitative and qualitative terms:
Table 3‑29
Probability of Failure Matrix
|
Asset |
Condition (/5) |
Condition Qualitative |
Probability of Failure Score (/5) |
Probability of Failure Score (Qualitative) |
|
Asset 1 |
5 |
Very Good |
1 |
Rare |
|
Asset 2 |
4 |
Good |
2 |
Unlikely |
|
Asset 3 |
3 |
Average |
3 |
Possible |
|
Asset 4 |
2 |
Poor |
4 |
Likely |
|
Asset 5 |
1 |
Very Poor |
5 |
Almost Certain |
This matrix can be scaled appropriately depending on the condition rating scale used by the municipality.
The following example of probability of failure (i.e. likelihood of failure) has been obtained from the IIMM[1]:
Table 3‑30
Sample Probability of Failure – IIMM
|
Likelihood |
Descriptor |
Probability of Occurrence |
|
Rare |
May occur only in exceptional circumstances |
More than 20 years |
|
Unlikely |
Could occur at some time |
Within 10-20 years |
|
Possible |
Might occur at some time |
Within 3-5 years |
|
Likely |
Will probably occur in most circumstances |
Within 2 years |
|
Almost certain |
Expected to occur in most circumstances |
Within 1 year |
Function, in addition to condition, can also be considered In more advanced determinations of probability of failure, asset capacity and functionality can also play a role in the calculation. Including these variables (as discussed earlier in this chapter), it is recognized that an asset can “fail” due to the assets inability to function correctly or address the needed capacity. An asset in perfect condition can technically fail if appropriate functionality and capacity is not being addressed.
Consequence of failure can be a more subjective calculation. To determine the overall consequence of an asset failing to a municipality, the following areas should be considered:
· Cost Impacts: The cost of failure to the municipality (i.e. capital replacement, rehabilitation, fines and penalties, damages, etc.);
· Social impacts: The potential injury to residents or municipal staff;
· Environmental impacts: The impact of the asset failure on the environment;
· Service delivery impacts: The impact of the asset failure on the municipality’s ability to provide services at desired levels, or potential service delivery interruptions; and
· Location impacts: The varying impact of asset failure based on the asset’s location within the municipality. For example, are assets servicing hospitals or schools a higher consequence? Does the municipality have a bridge that is the only access point to a region of the municipality for residents, fire, police, school buses and snow plows?
From an impact perspective, these areas can be incorporated into a consequence of failure calculation at a high level, using the following:
Table 3‑31
Consequence of Failure Matrix
|
Consequence of Failure |
Cost Consequences |
Other Consequences |
||
|
Social |
Environmental |
Service Delivery |
||
|
Insignificant |
Negligible or Insignificant Cost |
No Injury |
No Impact |
No Interruptions |
|
Minor |
Small/Minor Cost – within Budget Allocations |
Minor Injury |
Short-Term/Minor Impact – Fixable |
Minor Interruptions |
|
Moderate |
Considerable Cost – Requires Revisions to Budget |
Moderate Injury |
Medium-Term Impact – Fixable |
Moderate Interruptions |
|
Major |
Substantial Cost – Multi-Year Budget Impacts |
Major Injury |
Long-Term Impact – Fixable |
Major Interruptions |
|
Significant |
Significant Cost – Difficult to Recover |
Significant Injury |
Long-Term Impact – Permanent |
Significant Interruptions |
Alternatively, consequence of failure can be estimated by using asset attribute information found in the municipality’s asset registers for each asset class. For example, the type of road (local, collector, arterial) can play a role in establishing the consequence of failure for road assets, which assumes that there are differing consequences or criticalities for each type of road (i.e. an arterial road is more critical than a local road). For water and wastewater mains, the pipe diameter can play a role, assuming that different pipe diameters yield differing consequences/criticalities (i.e. larger diameter mains are more critical than smaller diameter mains). In these two examples, road type and pipe diameter are being used to quantify the number of residents that would be impacted by an asset failure. It is assumed an arterial road services more residents than a local road, and a larger diameter water pipe services more residents than a smaller diameter pipe.
The following table provides some examples of asset attributes that can be used to determine consequence of failure, or asset criticality:
Table 3‑32
Sample Asset Attributes in Determining Consequence of Failure
|
Asset Type |
Attribute |
Example of High CoF |
Example of Low CoF |
|
Roads and Bridges |
Road Type |
Arterial |
Local |
|
HCB |
Gravel |
||
|
Traffic |
High Traffic |
Low Traffic |
|
|
Speed Limit |
High Speed Limit |
Low Speed Limit |
|
|
Access |
Road/Bridge with only Local Access |
Many Roads/Bridges with Access |
|
|
Replacement Cost |
High Value |
Low Value |
|
|
Water, Wastewater, and Stormwater Mains |
Main Diameter |
High Diameter |
Low Diameter |
|
Trunk vs. Local Main |
Trunk Mains |
Local Mains |
|
|
Water Crossing |
Main Crosses Water |
Main Doesn’t Cross Water |
|
|
Replacement Cost |
High Value |
Low Value |
|
|
Facilities, Vehicles, Equipment, and Land Improvements |
Type of Service |
Fire, Water, Wastewater |
Parks, Recreation, Culture |
|
Service Delay |
Long Delay |
Short or No Delay |
|
|
Back-Up Asset Available? |
No |
Yes |
|
|
Replacement Cost |
High Value |
Low Value |
The following example of consequence of failure has been obtained from the IIMM[2]:
Table 3‑33
Consequence of Failure – IIMM
|
Consequences |
Description |
|
Insignificant |
No injuries, low financial loss (less than $10,000) |
|
Minor |
First aid treatment, on-site release immediately contained, medium financial loss ($10,000 - $50,000) |
|
Moderate |
Medical treatment required, on-site release contained with outside assistance, high financial loss ($50,000 - $200,000) |
|
Major |
Extensive injuries, loss of production capacity, off-site release with no detrimental effects, major financial loss ($200,000 - $1,000,000) |
|
Catastrophic |
Deaths, toxic release off-site with detrimental effect, huge financial loss (more than $1M) |
It is recommended that both probability of failure and consequence of failure be assigned either a quantitative or qualitative rating (similar to condition ratings). As shown in examples above, probability of failure can range from “Rare” to “Almost Certain” from a qualitative perspective, or quantitatively through a scale such as 0-5 or 0-10. Consequence of failure can range from “Insignificant” to “Significant” from a qualitative perspective, or quantitatively through a scale such as 0-5 or 0-10. The benefit of using a qualitative or numerical scale is the ability to mathematically incorporate both PoF and CoF into an overall risk or criticality rating.
With both probability of failure and consequence of failure documented, total asset risk or criticality can be determined using a matrix similar to the one shown below. Total risk/criticality in this example has been classified under the following categories:
· Extreme Risk (E): Risk well beyond acceptable levels (red);
· High Risk (H): Risk beyond acceptable levels (orange);
· Medium Risk (M): Risk at acceptable levels, monitoring required to ensure risk does not become high (yellow); and
· Low Risk (L): Risk at or below acceptable levels (green).
Table 3‑34
Total Risk of Asset Failure Matrix
|
Consequence of Failure |
|||||
|
Insignificant |
Minor |
Moderate |
Major |
Significant |
|
|
Rare |
L |
L |
M |
M |
H |
|
Unlikely |
L |
M |
M |
M |
H |
|
Possible |
L |
M |
M |
H |
E |
|
Likely |
M |
M |
H |
H |
E |
|
Almost Certain |
M |
H |
H |
E |
E |
When PoF and CoF are numerical (quantitative scale), the municipality must determine the correct way to “blend” them together to determine overall risk/criticality. Some options are as follows:
1. Multiply PoF and CoF together (i.e. using PoF and CoF scales out of 10 each, total risk would be a maximum of 10 x 10 = 100).
2. Add PoF and CoF together (i.e. using PoF and CoF scales out of 10 each, total risk would be a maximum of 10 + 10 = 20).
3. Use some type of weighted average of PoF and CoF (i.e. using PoF and CoF scales out of 10 each, and an assumption that PoF is more important to the calculation, total risk would be a maximum of 10 PoF (80%) + 10 CoF (20%) = Risk 10(100%)). Please see the figure below for an additional example illustration of how to calculate risk under Option 3.
Figure 3‑6
Example of Risk Rating Calculation – Weighted Average
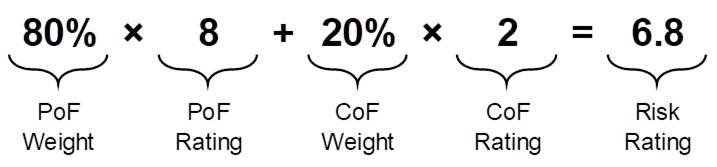
Options 1 and 2 assume that both PoF and CoF are equally as important in the calculation. Option 3 allows the option of weighting PoF and CoF so that one has a larger impact on the calculation (i.e. in the example above, it is assumed that PoF has 80% of the total impact on the overall formula).
Risk levels can be reduced or mitigated through planned maintenance, rehabilitation and/or replacement. An objective of asset management planning is to reduce risk levels where they are deemed to be too high, as well as ensure assets are maintained in a way that maintains risk at acceptable levels over the forecast period.
Table 3‑35 (below), illustrates an example of calculating risk/criticality for roads. In this example, probability of failure is based on asset condition (as discussed above), and consequence of failure is based on road type (in example 1) and traffic count (in example 2). The weighted approach to blending PoF and CoF together is also used (80%/20% respectively). It is important to note that municipalities should adjust and tweak the risk/criticality calculation so that it results in an accurate list of capital priorities (i.e. the highest risk assets). This can be done through trial and error. For example, a municipality can try one particular formula for assessing risk/criticality and review it with each department for accuracy. If priority projects are not coming to the top of the list, then determine why your formulas are not providing accurate results and adjust accordingly. Please note that more than one variable can be used in determining PoF or CoF. For example, if a municipality felt that both road type and traffic count should play a role in the calculation of CoF for roads, then both factors can be combined into an overall CoF calculation.
Table 3‑35
Example of Risk/Criticality Calculation – Roads
|
Example 1 – CoF based on Road Type |
Example 2 – CoF based on Traffic Count |
||||||||
|
Weight |
80% |
20% |
100% |
80% |
20% |
100% |
|||
|
Road |
Type |
Daily Traffic |
Cond. (/10) |
PoF (/10) |
CoF (/10) – Based on Type |
Risk / Criticality |
PoF (/10) |
Cof (/10) – Based on Traffic |
Risk / Criticality |
|
Road 1 |
Local |
100 |
8 |
2 |
4 |
2.4 |
2 |
4 |
2.4 |
|
Road 2 |
Collector |
500 |
6 |
4 |
6 |
4.4 |
4 |
4 |
4.0 |
|
Road 3 |
Arterial |
1,000 |
6 |
4 |
8 |
4.8 |
4 |
6 |
4.4 |
|
Road 4 |
Local |
50 |
7 |
3 |
4 |
3.2 |
3 |
4 |
3.2 |
|
Road 5 |
Collector |
400 |
4 |
6 |
6 |
6.0 |
6 |
4 |
5.6 |
|
Road 6 |
Arterial |
1,500 |
2 |
8 |
8 |
8.0 |
8 |
8 |
8.0 |
|
Road 7 |
Local |
200 |
7 |
3 |
4 |
3.2 |
3 |
4 |
3.2 |
|
Road 8 |
Collector |
800 |
6 |
4 |
6 |
4.4 |
4 |
6 |
4.4 |
|
Road 9 |
Arterial |
1,100 |
9 |
1 |
8 |
2.4 |
1 |
8 |
2.4 |
|
Road 10 |
Local |
50 |
10 |
0 |
4 |
0.8 |
0 |
4 |
0.8 |
|
highest priority |
|
||||||||
As discussed above, risk mitigation or redundancy adjustments can be made to account for:
· Processes the municipality has that automatically offset the risk calculation; and
· Whether redundancy/backup assets exist.
These adjustments become a direct reduction to consequence of failure.
According to IIMM, critical assets are defined as: “assets for which the financial, business or service level consequences of failure are sufficiently severe to justify proactive inspection and rehabilitation. Critical assets have a lower threshold for action than non-critical assets”.
The level of risk or criticality is used to determine asset treatments. Treatments can range from immediate corrective action (such as stopping work or preventing use of the asset) for ‘Very High’ risks, to managing by routine procedures for ‘Low’ risks.
An asset with a ‘High’ risk rating will require ‘prioritized action’. This may include actions such as reducing the probability of the event occurring by physical methods (i.e. limiting usage to within the asset’s capacity, increasing monitoring and maintenance practices, etc.), reducing consequence of failure (i.e. limiting speed of use, preparing response plans, etc.) and/or sharing the risk with others (insuring the organization against the risk). A treatment or action table example is as follows:
Table 3‑36
Sample Treatment/Action Table
|
Action Required |
||
|
VH |
Very High Risk |
Immediate corrective action |
|
H |
High Risk |
Prioritized action required |
|
M |
Medium Risk |
Planned action required |
|
L |
Low Risk |
Manage by routine procedures |
Keeping condition assessments and risk assessments current can also be undertaken with different approaches. Since risk is tied to condition (i.e. probability of failure is often tied to condition), these two concepts should be considered together. With condition assessments kept current, it makes the risk assessment more accurate.
To what extent is asset risk/criticality used to determine how frequently asset conditions are assessed?
An important factor in determining the frequency of performing asset condition assessments is the level of risk/criticality.
To what extent is asset risk/criticality used to determine how frequently asset conditions are assessed?
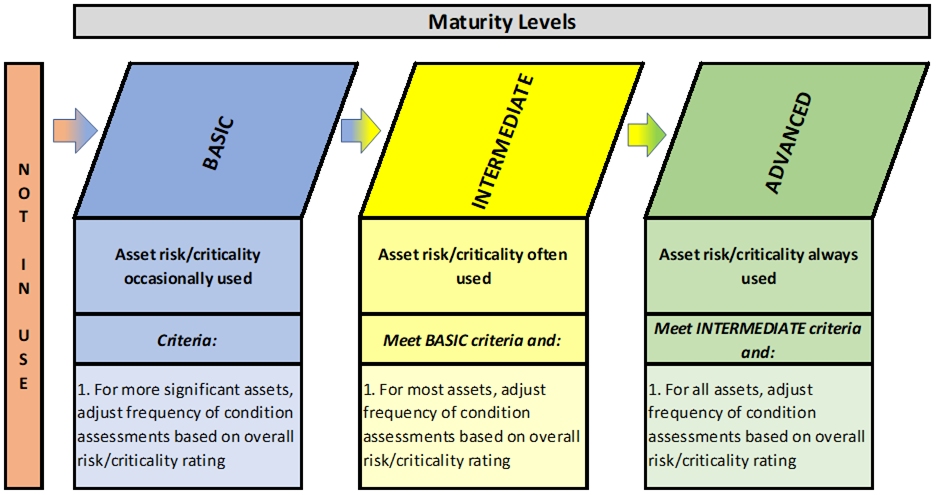
At the basic level of maturity, overall asset risk/criticality is used occasionally to determine the frequency of condition assessments. It is suggested that at this level, the emphasis should be placed on more significant (complex) assets.
At the intermediate level of maturity, overall asset risk/criticality is often used in determining the frequency of condition assessments. At this level, most assets would be included in these assessments.
At the advanced level of maturity, overall asset risk/criticality is always used for all assets when determining the frequency of condition assessments.
This section focuses on a municipality’s responsiveness to the results of its risk/criticality assessments in determining how often to conduct condition assessments. For example, assets may generally be assessed for condition once every five years (subject to legislative requirements). However, if a specific asset or asset type has a higher risk/criticality, the condition assessment(s) may be undertaken earlier to compensate. With this practice, it is realized that more critical assets may require more frequent condition/risk assessments in order to ensure risk is kept at acceptable levels. For example, in general a municipality may assess condition on facilities every 5 years; however, it is common to assess condition on more critical facilities every 3 years or even annually for highly critical facilities. See Table 3-37 (below) for an example:
Table 3‑37
Sample Condition Assessment Timeline based on Risk Assessment
|
Risk Assessment |
Complex Assets: Frequency of Condition Assessments |
|
Extreme |
Detailed Condition Assessment Every Year |
|
High |
Staff Inspections Every Year Detailed Condition Assessment Every 3 Years |
|
Medium |
Staff Inspections Every Year Detailed Condition Assessment Every 5 Years |
|
Low |
Staff Inspections Every Year Detailed Condition Assessment Every 7 Years |
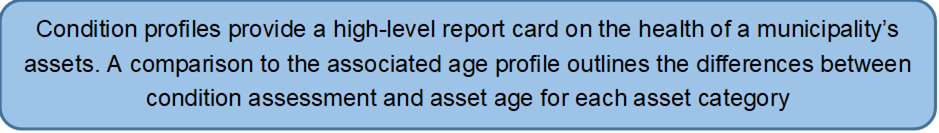
Has an age/condition profile been developed for all assets?
Age and condition are important elements in assessing the state of local infrastructure.. This information allows municipalities to perform analysis of the future service potential for its assets. In general, an age profile represents the age of the assets and the proportion of asset age to expected useful life. Asset condition profiles focus on the proportion of assets that may be assessed at different levels of condition (i.e. good, fair, poor).
Has an age/condition profile been developed for all assets?
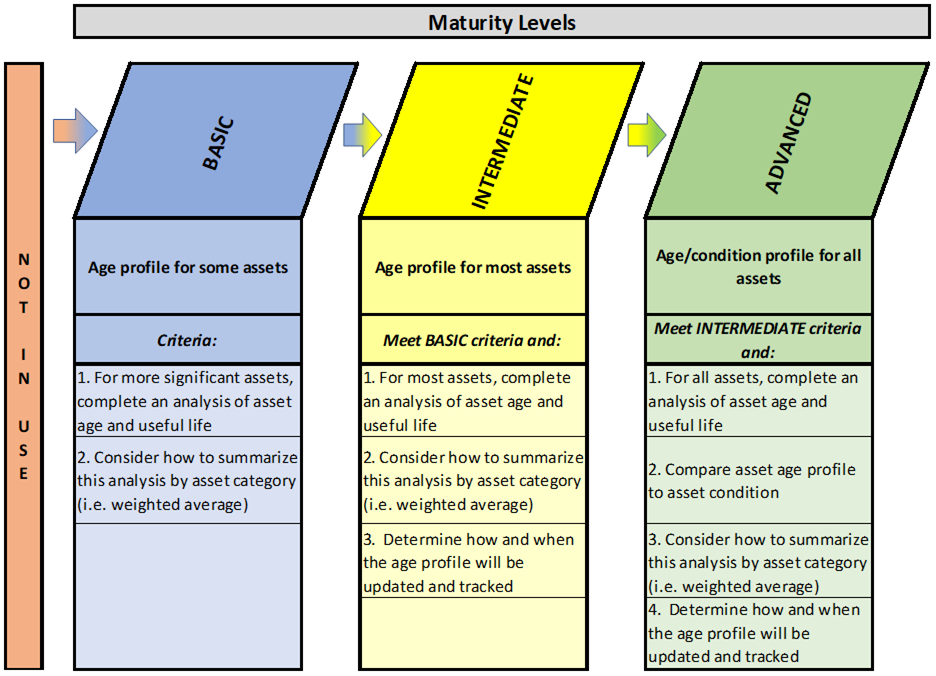
At the basic level of maturity, municipalities have developed an age profile for more significant assets. Consideration should be given to summarizing this analysis by asset category to provide insight into the age profiles at that level of detail. It is common to summarize this analysis by using a weighted average, based on the cost (current valuation) of the individual assets within an asset category, when determining an overall age profile for the asset category.
At the intermediate level of maturity, the age profile would be determined for most assets, with the results summarized by asset category.
At the advanced level of maturity, the age profile would be determined for all assets, but would also include a comparison to the condition profile for these assets. As a result, a similar but more robust analysis can be prepared, showing the difference between the age-based and condition-based assessment summaries.
Service Capacity is defined as:
The total future service capacity of an asset. It is normally determined by reference to the operating capacity and economic life of an asset. (IIMM 2011)
An asset’s service capacity refers to the output that the asset is able to sustain in delivering a service. Therefore, service potential is a function of both the level of output and the remaining service life of the asset.
There are a number of ways asset service potential can be assessed and monitored. Typically, they involve some assessment of the degree to which the useful life of an asset, or group of assets, has been consumed. The simplest method to assess service potential is to compare age to useful life. Assuming both are relatively accurately recorded, the result will indicate how long an asset is likely to continue to provide service, strictly from an age perspective. Similarly, this method can be used to assess a network, either by quantifying the assets in similar ranges of life consumed, or by deriving the average (or weighted average) ratio between age and useful life. It is important to note that the ‘Building Together – Guide for Municipal Asset Management Plans includes the requirement to include within an AM plan one or more tables summarizing:
Asset age distribution and asset age as a proportion of expected useful life.
It is important to be aware that there are significant limitations with age-based assessments. Assets will often either have an actual service life significantly shorter or longer than the theoretical useful life assigned. This may occur for a number of reasons, including: greater than expected use, variations in construction, a change in the required levels of service, very good or very poor maintenance history, and/or an initial lack of understanding of the true service life.
On a network or asset group basis, the overall condition profile can be analyzed to provide an indication of the remaining service potential of the entire asset stock.
The figure below shows an overall condition profile for the pavement component of a road network. In this example, condition 5 (shown in red) is the intervention level for asset replacement and condition 0 (shown in dark green) is a new asset.
Figure 3‑7
Sample Overall Condition Profile – Road Pavement Network
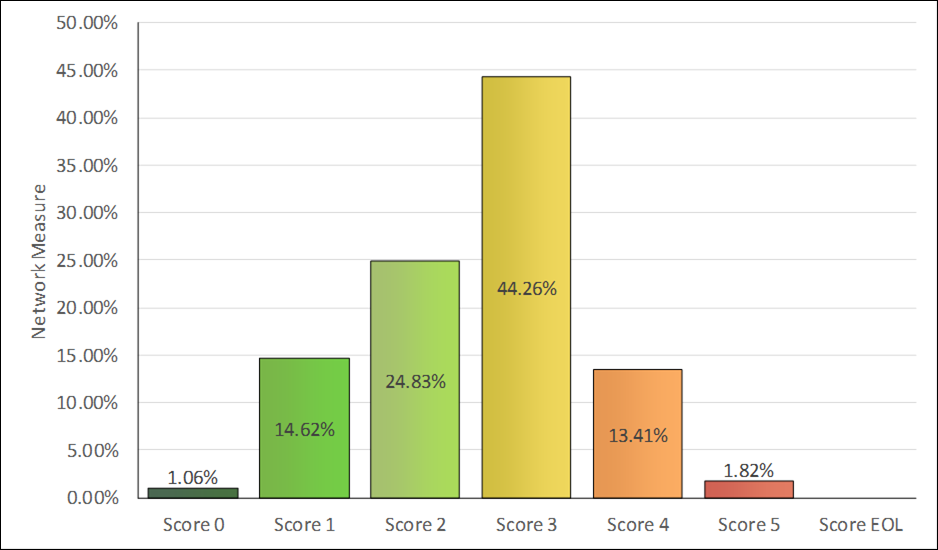
Based on the information represented in the above figure, we can calculate the percentage service potential remaining for this asset group. The table below takes the condition profile above and applies remaining service-potential percentages (as determined by the municipality) for each rating level, to calculate the percentage service potential remaining for the pavement component of the road network:
Table 3‑38
Sample Service Potential Calculation – Road Pavement Network
|
Rating |
Network % |
Service Potential % |
Remaining Service Potential |
|
0 |
0.13 |
100 |
0.13 |
|
1 |
14.62 |
80 |
11.70 |
|
2 |
24.83 |
60 |
14.90 |
|
3 |
45.26 |
40 |
18.10 |
|
4 |
13.41 |
20 |
2.68 |
|
5 |
1.75 |
0 |
0 |
|
Percentage Service Potential Remaining |
47.51% |
||
In summary, it is useful to conduct an analysis of a municipality’s age profile and service potential. While an age-based approach will illustrate how old the assets are, a condition or service-potential approach will provide more accurate information with respect to the state of a municipality’s assets. An example of combining an age-based and condition-based profile is provided below. Based on the colour coding identified, there can be a significant difference in remaining life when comparing an age-based assessment to a condition-based assessment.
Table 3‑39
Sample Comparison of Age-based and Condition-based Assessments
|
Age-Based Analysis |
Condition-Based Analysis |
|||||
|
Useful Life |
Age |
Remaining Life |
Condition (/10) |
Condition- Based Remaining Life |
Remaining Life |
|
|
Asset 1 |
50 |
50 |
0% |
3 |
15 |
30% |
|
Asset 2 |
50 |
45 |
10% |
1 |
5 |
10% |
|
Asset 3 |
50 |
40 |
20% |
3 |
15 |
30% |
|
Asset 4 |
50 |
35 |
30% |
4 |
20 |
40% |
|
Asset 5 |
50 |
30 |
40% |
6 |
30 |
60% |
|
Asset 6 |
50 |
25 |
50% |
4 |
20 |
40% |
|
Asset 7 |
50 |
20 |
60% |
7 |
35 |
70% |
|
Asset 8 |
50 |
15 |
70% |
6 |
30 |
60% |
|
Asset 9 |
50 |
10 |
80% |
8 |
40 |
80% |
|
Asset 10 |
50 |
5 |
90% |
9 |
45 |
90% |
|
Good |
|
|||||
|
Average |
|
|||||
|
Poor |
|
|||||
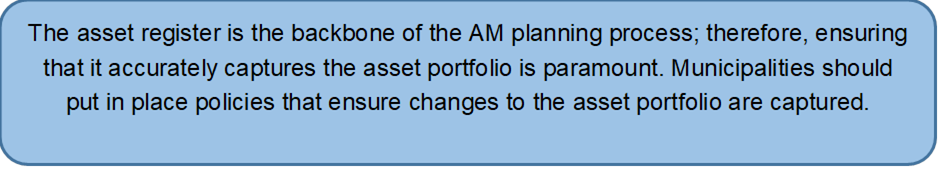
Is there a process in place to record new acquisitions/disposals in the asset register(s)?
Once the asset register has been created consideration needs to be given to the process of keeping it current. Discussions regarding updating replacement cost, condition ratings, and risk assessments can be found in previous sections; however, updating the asset register for new acquisitions/disposals information is also important. This information can come from a number of sources; therefore, municipalities will have to be prepared to collect relevant details and use them to update the asset register accordingly.
Is there a process in place to record new acquisitions/disposals in the asset register(s)?
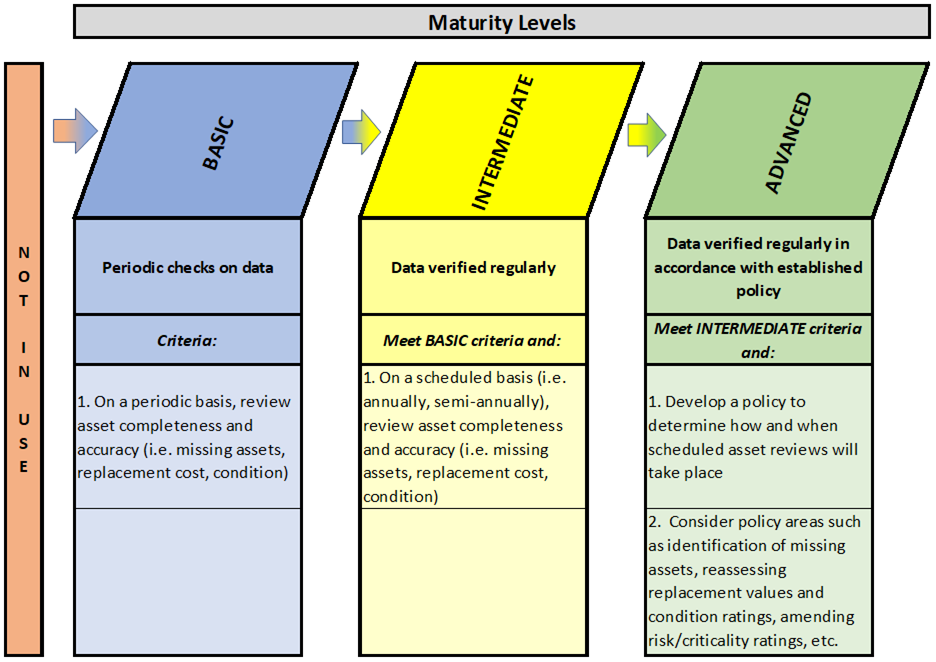
At the basic level of maturity, municipalities periodically update their asset data for new acquisitions/disposals. Municipalities at this level may update their PSAB 3150 asset data annually for acquisitions/disposals, betterments, etc., in order to complete financial statements and the Financial Information Return (FIR). Other asset registers, which are used for asset management purposes, would be updated periodically.
At the intermediate level of maturity, asset data for new acquisitions/disposals is updated on a regular basis. PSAB 3150 asset data may updated on a scheduled basis, as opposed to waiting for year end. Similarly, the asset registers would be updated on a scheduled basis.
At the advanced level of maturity, asset data for new acquisitions/disposals is updated regularly, in all asset registers, in accordance with established policy. This would require municipalities to review and update their asset policies to be in line with asset management needs (i.e. acquisitions, disposals, capitalization thresholds, etc.). Then, following policy requirements, all asset registers should be updated accordingly.
There may be multiple sources of information related to asset additions to monitor. Most asset addition costs will flow through the accounts payable and payroll systems of a municipality’s financial system. Consideration should be given to appropriate account/job costing identification within the accounting systems in order to simplify the accurate collection of costs for assets.
There are also instances where asset additions occur, but no evident costing or attribute information is available. This could occur when assets are donated (contributed) or assumed from developers. In these cases, a municipality needs a process in place to be made aware of these contribution events in order to know when to record these contributed assets, and to have access to all required information to record the applicable assets, such as benchmark costs, engineering specifications, etc.
Another type of asset “addition” is the recording of missing assets. From time to time, municipalities may find assets that they own and manage that are not recorded in the asset register. While this technically is not an asset addition for accounting purposes, it is a needed addition to the asset register. Keep capitalization thresholds in mind when deciding whether or not to record these missing assets.
Capitalization thresholds can play a significant role in determining how to update the asset register(s). Capitalization thresholds represent the amount that is significant enough to a municipality, in each asset area, to warrant a discussion regarding capitalization. Any costs below identified capitalization thresholds are simply expenses in operations. Keep in mind that capitalization thresholds are also kept for accounting (PSAB 3150) purposes, and these thresholds can differ from identified asset management capitalization thresholds, if needed.
Asset disposal can occur in a number of ways including trade-ins, asset retirement/decommissioning, removal of existing linear assets when constructing new linear assets, and selling of buildings or other assets. Each municipality must monitor the sources of information that would identify all disposals, and ensure it triggers the related changes to the asset register.
Municipalities will need to be aware of how best to share information across departments as it relates to whether work done on assets has created changes to asset attributes, thus necessitating updates to the asset register. For example, when a road is changed from gravel to a paved surface, the attribute for material type will need to be changed. Another example includes widening a bridge or a sidewalk (thus changing the dimensions of the asset).
To what extent have major assumptions been assessed and documented?
Within asset management data, a number of assumptions will have been made for a variety of purposes. There will be occasions when these assumptions may be questioned (i.e. from auditors or staff), or reviewed for continuing applicability by municipal staff. It is recommended that all major assumptions related to asset management data be documented to facilitate clarity and reasoning.
To what extent have major assumptions been assessed and documented?
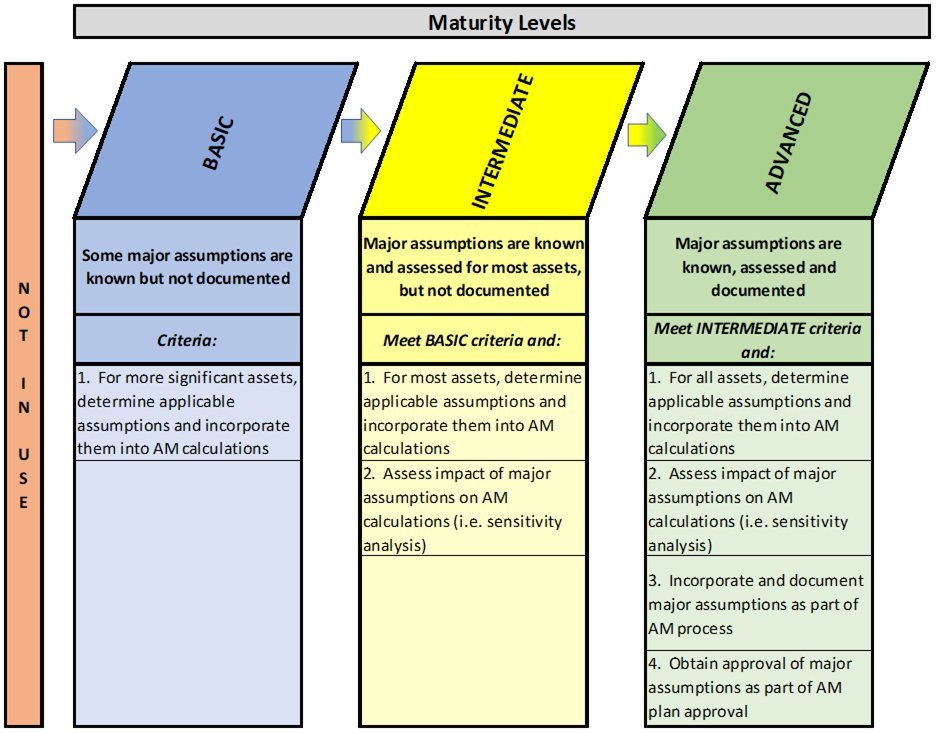
At the basic level of maturity, municipalities make use of some major assumptions in their asset management calculations for significant assets but may not document them.
At the intermediate level of maturity, all major assumptions are known and assessed for asset management calculations related to most assets, but documentation may still be lacking. The impact of the major assumptions on asset management calculations may be assessed using techniques such as sensitivity analysis.
At the advanced level of maturity, all major assumptions are known, assessed, and documented for asset management calculations related to all assets. As with the intermediate level of maturity, the impact of the assumptions would be assessed. In moving from intermediate to advanced maturity, major assumptions should be documented (i.e. through a process manual). The major assumptions can be approved as part of the overall asset management plan approval.
Given the number of possible updates to the asset register, the number of sources of information, and the breadth of staff and potential consultants in an organization involved in the various aspects of asset management, a formal process manual can be beneficial to track all assumptions and ensure a consistent application of methodologies across the asset register. The manual can be used to identify how the asset register is to be updated, when updates take place and by whom. The major assumptions to be made can also be identified and documented as part of the process manual.
In order to facilitate consistency, issues such as staff/consultant hiring, training, and performance review (see Chapter 10 for more discussion on these issues) should be touched upon in the manual. Having a manual in place should assist in providing a level of consistency to the updates being performed.
Government of Canada, Treasury Board of Canada Secretariat Organization, https://www.canada.ca/en/treasury-board-secretariat/corporate/risk-management.html
Institute of Public Works Engineering Australasia (IPWEA), NAMS.PLUS Asset Management, https://www.ipwea.org/communities/assetmanagement/namsplus
IPWEA 2012, Long-Term Financial Planning Practice Note 6, https://www.ipwea.org/viewdocument/ipwea-long-term-fina
IPWEA, 2015, Australian Infrastructure Financial Management Manual , https://www.ipwea.org/publications/bookshop/ipweabookshop/aifmm
IPWEA, 2015, International Infrastructure Management Manual, https://www.ipwea.org/publications/bookshop/ipweabookshop/iimm
International Organization for Standardization (ISO), 2009, ISO 31000:2009, Risk management – Principles and guidelines, https://www.iso.org/iso-31000-risk-management.html
ISO, 2014, ISO 55000:2014, Asset management – Overview, principles and terminology, http://www.iso.org/iso/catalogue_detail?csnumber=55088
Public Sector Accounting Board, 2006, PS 3150 Tangible Capital Assets
Public Sector Accounting Group of the Canadian Institute of Chartered Accountants, 2007, Guide to Accounting for and Reporting Tangible Capital Assets, http://www.frascanada.ca/standards-for-public-sector-entities/resources/reference-materials/item14603.pdf