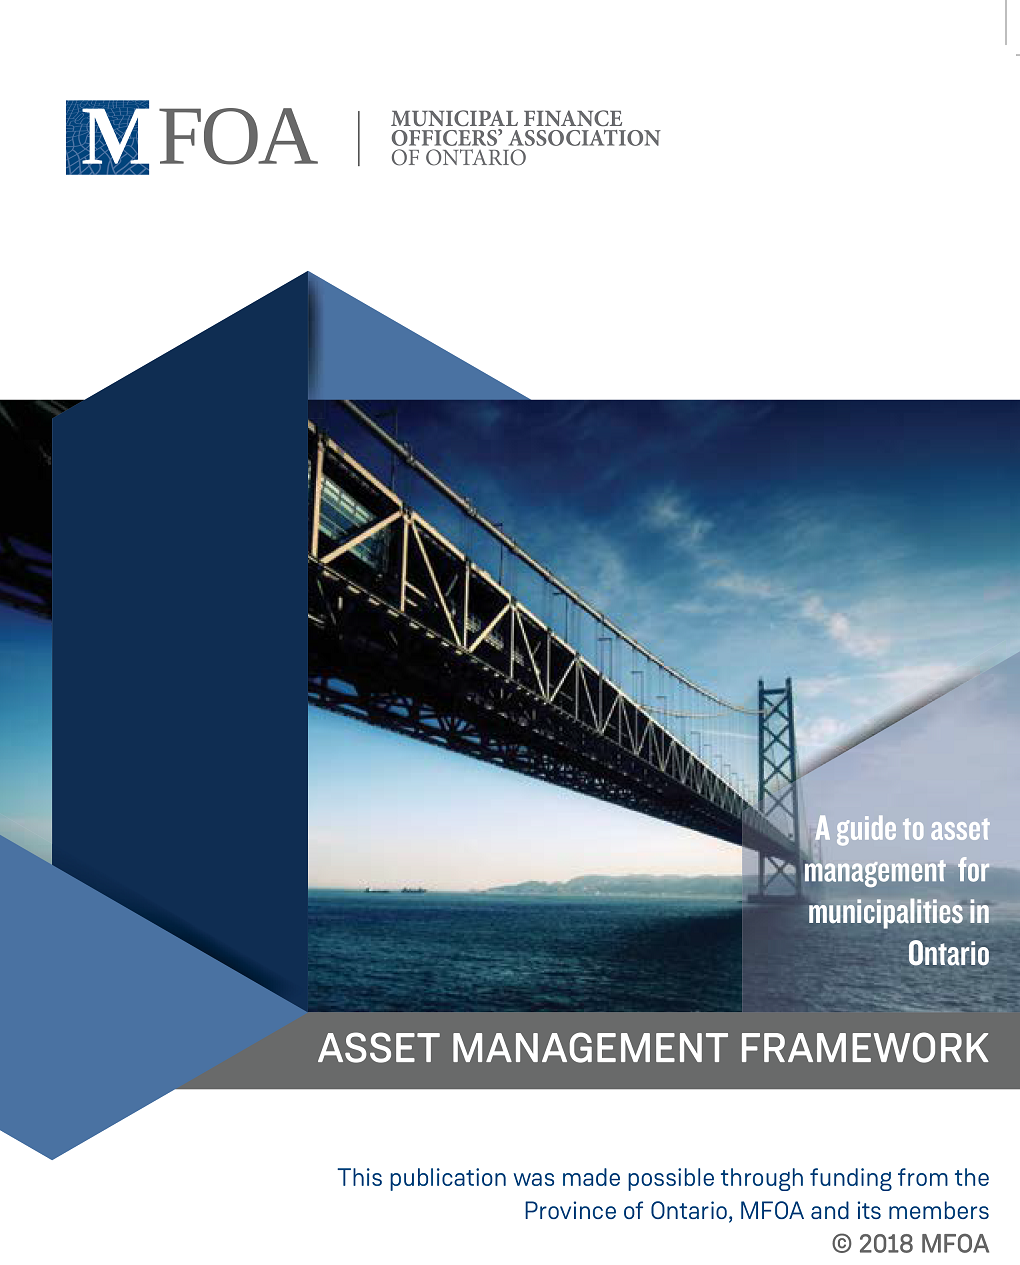
This framework is intended for municipalities of all sizes
and maturity levels. The use of maturity diagrams within this framework will
assist municipalities to identify their current levels of maturity for each AM
area. Furthermore, for municipalities that have a desire to move to a higher
level of maturity over time, the diagrams will provide potential approaches to
doing so. To more easily depict the maturity levels ascribed to specific
questions posed within the framework, the following diagram will be utilized
for each question:
Municipalities that are not undertaking the components
described in a particular section of this framework should focus on meeting the
basic level requirements outlined in the maturity level diagram.
At the basic level of maturity, a municipality is
undertaking the components of asset management shown in blue and will take
steps to advance their asset management by implementing the components
described under the intermediate level heading.
At the intermediate level of maturity, a municipality
is currently meeting the requirements shown in yellow and to advance their
asset management will take steps to implement the components described under
the advanced level heading.
At the advanced level of maturity, a municipality is
currently meeting the requirements shown in green.
These maturity framework visuals are found throughout this
document. Preceding all maturity level diagrams is a self-assessment question
for the reader to consider to help determine where their municipality best fits
within the framework.
4.2
Overview
Levels of Service (LOS) Analysis is a component of asset
management planning that is significant and has a great deal of impact.
Municipalities must not lose sight of the fact that its core purpose is to
provide services to residents and other stakeholders. Assets help to provide
those services and most of the resources devoted to asset management planning
are spent on infrastructure. In this respect, physical assets are simply a
portion of what is required to deliver the various levels of service as
determined by the municipality. The municipality needs to ensure that the
infrastructure performs to meet the level of service goals at an affordable and
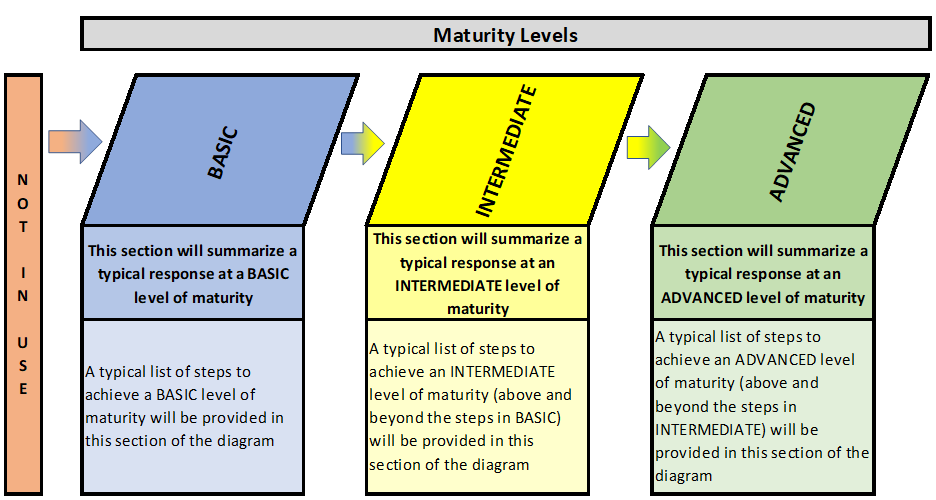
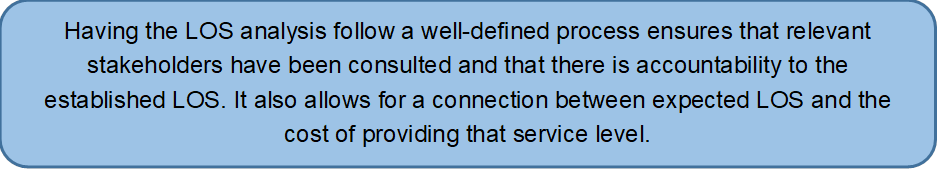
sustainable cost. An objective of an LOS analysis is to find a balance between
the expected level of service and the cost of providing that level of service.
Figure 4‑1
Balance between Level of Service and Cost
An LOS analysis includes:
·
Service identification with the identification of assets
involved in providing the services and the stakeholders impacted;
·
Determination of community expectations with respect to
services;
·
Determination of strategic levels of service, based on
community expectations (frequently referred to as customer levels of service);
·
Determination of technical levels of service for each
strategic level of service;
·
Comparison of existing levels of service to expected
strategic/technical levels of service;
·
Use of performance measures to assist in comparing
existing service levels to expected levels; and
·
An assessment of the lifecycle cost implications of moving
from existing levels of service to expected (desired) levels of service over a
forecast period.
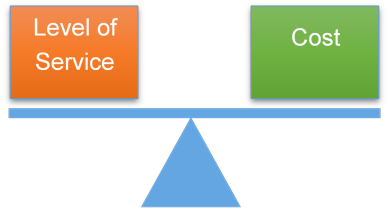
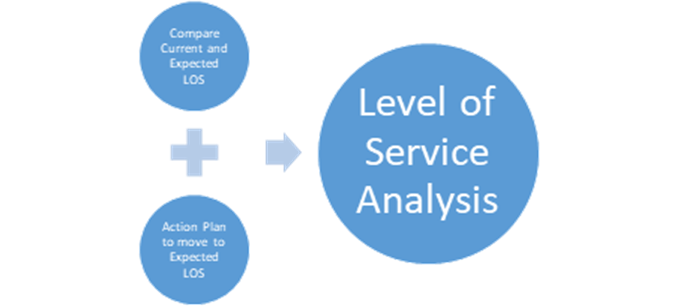
These components of the LOS analysis can be viewed from a
hierarchy or pyramid perspective (see Figure 4‑2 below), where the
technical levels of service are needed to fulfill strategic levels of service, which
are needed to satisfy community expectations, which are all based on a
particular service or services being provided.
Figure 4‑2
Level of Service Analysis Components
The outcome from identifying and determining levels of
service can take on many forms, including:
·
Qualitative descriptions of services and service levels;
·
Identifications of programs, procedures, and/or activities that
are required to achieve particular service levels; and
·
Performance measures or key performance indicators (KPIs) that
can illustrate the progression of service levels (i.e. through trending
analysis) and an ultimate objective or target performance measure/KPI for which
to strive.
The following sections are designed to assist municipalities
understand their level of asset management maturity with respect to developing
an LOS analysis within the asset management planning process. Each of the
components introduced above are explained in more detail below.
Infrastructure for Jobs and Prosperity (IJPA) Act and O.
Reg 588/17 Requirements
O.Reg 588/17 outlines the
following requirements with respect to levels of service:
Every municipality shall prepare an asset management plan in
respect of its core municipal infrastructure assets by July 1, 2021, and in
respect of all of its other municipal infrastructure assets by July 1, 2023.
A municipality’s asset management plan must include the
following:
a) For each asset
category, the current levels of service being provided, determined in accordance
with the following qualitative descriptions and technical metrics and based on
data from at most the two calendar years prior to the year in which all
information required under this section is included in the asset management
plan:
i.
With respect to core municipal infrastructure assets, the qualitative
descriptions set out in Column 2 and the technical metrics set out in Column 3
of Table 1, 2, 3, 4 or 5, as the case may be.
ii.
With respect to all other municipal infrastructure assets, the
qualitative descriptions and technical metrics established by the municipality.
b) The current
performance of each asset category, determined in accordance with the
performance measures established by the municipality, such as those that would
measure energy usage and operating efficiency, and based on data from at most
two calendar years prior to the year in which all information required under
this section is included in the asset management plan.
By July 1, 2024, every asset
management plan must include the following additional information:
a) For each asset
category, the levels of service that the municipality proposes to provide for
each of the 10 years following, determined in accordance with the following
qualitative descriptions and technical metrics:
i.
With respect to core municipal infrastructure assets, the qualitative
descriptions set out in Column 2 and the technical metrics set out in Column 3
of Table 1, 2, 3, 4 or 5, as the case may be.
ii.
With respect to all other municipal infrastructure assets, the
qualitative descriptions and technical metrics established by the municipality.
b) An explanation
of why the proposed levels of service are appropriate for the municipality,
based on an assessment of the following:
i.
The options for the proposed levels of service and the risks associated
with those options to the long term sustainability of the municipality.
ii.
How the proposed levels of service differ from the current levels of
service set out.
iii.
Whether the proposed levels of service are achievable.
iv.
The municipality’s ability to afford the proposed levels of service.
c) The proposed
performance of each asset category for each year of the 10-year period,
determined in accordance with the performance measures established by the
municipality, such as those that would measure energy usage and operating
efficiency.
Please refer to Table 4-15 below in the Performance Measures
section for details regarding the contents of “Tables 1 to 5” as per O.Reg
588/17.

Have your services been determined?
Background
Identifying and determining services to provide is
beneficial for several reasons. For asset management planning, identifying
services is an important step in developing the LOS analysis. Once the
municipality has identified the services it is providing and what services it
wishes to provide, then the level of service to be provided can be determined. Service
reviews can be undertaken by both formal and informal means and involve a
number of stakeholders including staff, Council, and the public.
Levels of Maturity
– Service Review
Have your services been determined?
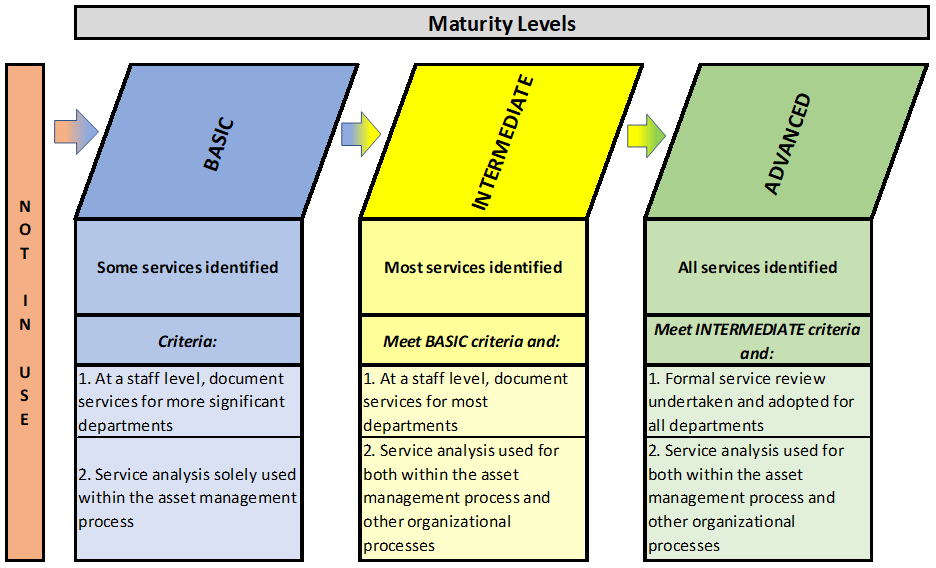
At the basic level of maturity, municipalities will
identify and determine the service levels of more significant services.
Typically, this would occur at the staff level in an informal process and would
focus on departments or services such as roads, water, and wastewater. The
service analysis will likely only be used within the asset management process
in completing an LOS analysis.
At the intermediate level of maturity, staff will
identify and document most services provided by the municipality. The service
analysis will be used in both the asset management process, as well as other
organizational processes. At this level, the analysis is likely still informal,
however, it would involve input from applicable departments within the
municipality.
At the advanced level of maturity, all services are
identified, documented and service levels determined. This is typically
undertaken using a more formal service review process with the results adopted
and approved by Council for all departments. This process includes the
identification of assets that contribute to providing each service, detailed
descriptions in relation to “how” and “why” the services are being provided,
and a review of stakeholders impacted by each service area. The service
analysis is used in both the asset management process, as well as other
organizational processes.
Service Reviews
Given that the asset management planning process is in place
to determine how assets will provide services to residents and other
stakeholders, the identification of services is a critical “first step” to
initiate the LOS analysis. Municipalities provide all of the legally mandated
services, as well as a multitude of other services desired by the residents.
The development of a “service centric” asset management process entails
understanding and answering the following questions for all services:
·
What are the services that we think we are to provide?
·
What are the services that our customers expect?
·
What are the services that we are really providing today?
·
What assets are involved in providing each service?
At this stage, a municipality is not identifying how the
services should be provided, or the level of that service to be provided.
Identifying core services is a process of understanding and documenting the
services the municipality provides today and intends to provide going forward,
in addition to the assets needed to provide each service. Examples include the
following:
Table 4‑1
Sample Services and Related Assets
|
Department
|
Services
|
Applicable
Assets
|
|
Transportation Services
|
Roads
|
Road base, surface, bicycle lanes,
turning lanes, etc.
|
|
Bridges and Culverts
|
Structure, deck, surface, etc.
|
|
Sidewalks
|
Sidewalks
|
|
Streetlights
|
Poles, fixtures, etc.
|
|
Traffic Lights
|
Poles, lights, controllers, etc.
|
|
Transit
|
Vehicles, facilities, equipment, etc.
|
|
Parking
|
Lots, lights, facilities, equipment,
etc.
|
|
Winter Control
|
Vehicles, equipment
|
|
Environmental
|
Water Distribution
|
Water mains, wells, pumps, towers,
valves, hydrants, etc.
|
|
Water Treatment
|
Treatment plant (treatment systems,
chlorination, pumps, chemical injection and filtration, piping, SCADA, pump
houses, etc.
|
|
Wastewater Collection
|
Mains, pumping systems, manholes, etc.
|
|
Wastewater Treatment
|
Treatment plant (separators, aeration
systems, pumps, chemical systems, SCADA, settlement ponds, facilities, etc.)
|
|
Stormwater
|
Urban: Stormwater mains, catch basins,
ponds, headwalls, etc.
|
|
Rural: Open ditches, culverts, ponds,
headwalls, etc.
|
|
Solid Waste Collection
|
Vehicles, transfer stations, weigh
scales, containers, etc.
|
|
Solid Waste Disposal
|
Landfills, monitoring wells,
compactors, bulldozers/loaders, etc.
|
|
Solid Waste Diversion
|
Transfer stations, vehicles, containers,
etc.
|
|
Protection Services
|
Fire
|
Vehicles, equipment, facilities,
hydrants, etc.
|
|
Police
|
Vehicles, equipment, facilities, etc.
|
|
Protective Inspection and Control
|
|
Recreation and Cultural Services
|
Recreation Facilities
|
Facilities (arenas, pools, community
halls, etc.), vehicles, equipment
|
|
Parks
|
Vehicles, equipment, facilities,
active parks, passive parks, etc.
|
|
Libraries
|
Facilities,
equipment, etc.
|
|
Museums
|
|
Health Services
|
Public Health/Hospitals
|
Facilities, equipment, etc.
|
|
Ambulance Services
|
Facilities, vehicles, equipment,
dispatch equipment, etc.
|
|
Cemeteries
|
Land improvements, facilities,
equipment, etc.
|
|
Social Services and Social Housing
|
Assistance to Aged Persons
|
Facilities, equipment, etc.
|
|
Child Care
|
Facilities, equipment, etc.
|
|
Housing/Co-op/Rent
|
Facilities, equipment, etc.
|
|
Planning and Development Services
|
Residential/Industrial/
Commercial/Agriculture
|
Land, services, etc.
|
|
General Government
|
Administration
|
Equipment, vehicles, facilities, etc.
|
The levels of service in each area
will be added to this analysis in later sections.
More comprehensive service reviews
can include additional information, such as why services are being provided, as
well as pros/cons associated with providing each particular service. For
example, a municipality may be struggling with the idea of providing serviced
industrial land to promote industrial growth. If a municipality decides not to
directly provide this service, agreements can be put in place to allow local
developers to provide it.
To add to the service
identification process, a municipality can decide to include the identification
of specific customers and other stakeholders involved in providing services.
Common customer/stakeholder groups could include:
·
Landowners (i.e. property taxation base);
·
External users (e.g. water, wastewater, parks, recreation,
library, policing, fire, solid waste, etc.);
·
Internal municipal users (e.g. senior management,
inter-departmental services, supervisors, technical staff, etc.);
·
Elected officials;
·
Regulatory agencies;
·
Municipal agencies;
·
Special interest groups;
·
Vendors or business owners; and
·
Developers.
As with the service identification
outcomes, the list of customers/stakeholders can be enhanced to mention the
interests and positions of each of the groups identified as well as how various
levels of service may impact them.
What process was followed in developing the level of
service analysis?
Background
While the later sections in this
chapter focus on the specific content of an LOS analysis, this section deals
with the steps involved in the process, as well as who is involved. Levels of
service relates to the overall service objectives of the organization. Therefore,
it makes sense to consider the involvement of all departments that provide
services within the LOS development process. Also, decisions will be made
regarding the sources of information to be included in the analysis, which may
include input and decisions from technical staff, management, Council, and the
public.
Levels of Maturity
– Level of Service Analysis
What process was followed in
developing the level of service analysis?
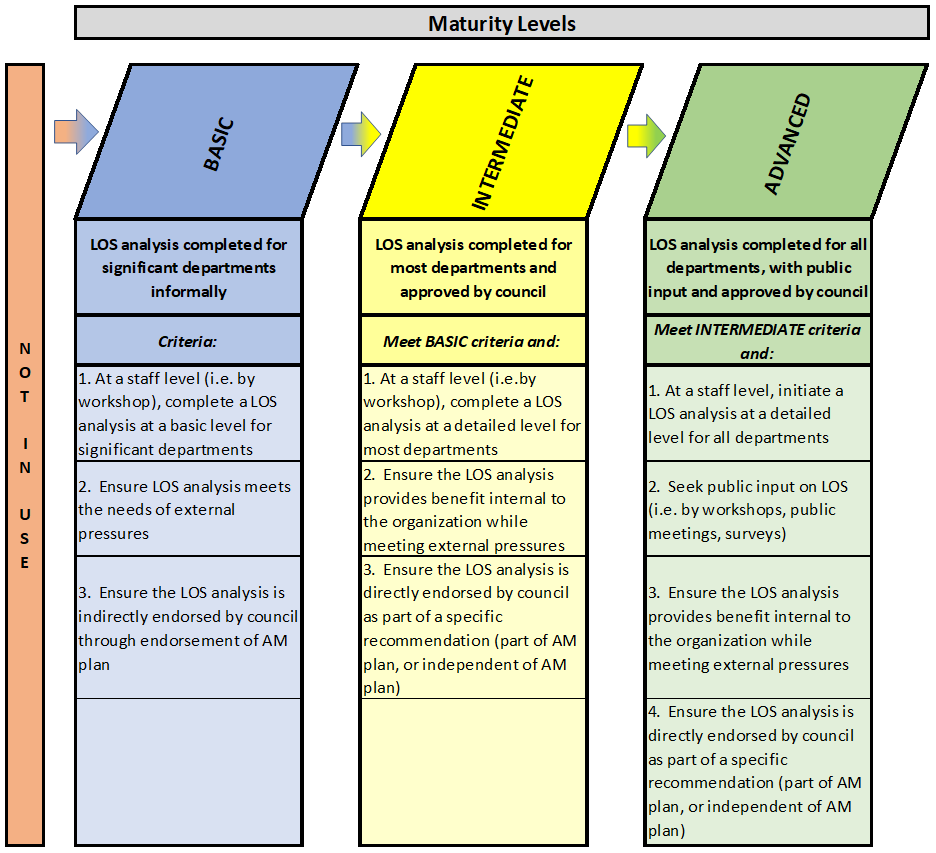
At the basic level of maturity,
the LOS analysis is likely completed for significant departments only. The
process is usually conducted informally by a group of staff through workshops,
meetings, or similar types of activity. The analysis may be undertaken at a
more cursory or basic level, and is primarily being undertaken due to the
external pressures of having an LOS analysis within the organization’s asset
management plan (i.e. following O.Reg 588/17). Staff should ensure Council
endorses the LOS analysis, even if done so indirectly as part of their
endorsement of the overall asset management plan.
At the intermediate level of
maturity, the LOS analysis will now be completed for most departments that
provide services. With most departments included in the analysis,
representatives from each department provide input in the process. Staff
complete a detailed LOS analysis, ensuring both internal organizational
objectives and external asset management pressures are addressed. Council
should directly endorse the LOS analysis by specific recommendation, either as
part of the asset management plan endorsement, or through independent report(s)
completed as part of the overall asset management process.
At the advanced level of
maturity, staff will undertake a detailed LOS analysis for all departments
that provide services. Input from the public is sought through the use of
workshops, public meetings, and/or surveys. The LOS analysis is undertaken
taking into consideration the public input. Both internal organizational
objectives and external pressures should be addressed through the LOS analysis.
Council should directly endorse the LOS analysis by specific recommendation
either as part of the asset management plan endorsement, or through independent
report(s) completed as part of the overall asset management process.
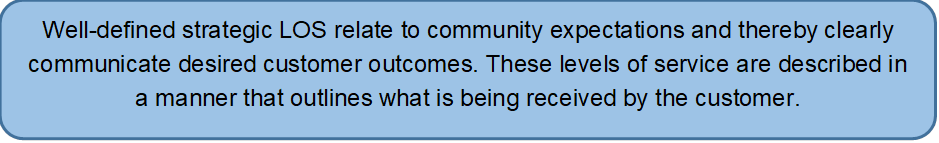
What are Levels of
Service?
An understanding of the levels of
service provided by a municipality is required in order to effectively deliver
services using municipal capital assets. Capital assets are only in place to
deliver identified services to the community. Therefore, municipal staff and
Council should have a strong understanding of the service levels expected by the
community, while also taking into consideration what service levels are
affordable. Although the community desires for service level can limitless,
what the community is willing to pay for is often less so. Through the LOS
analysis, community needs and expectations are considered, and also measure
against the cost and the willingness to pay.
The IIMM defines LOS as “the
defined service quality for a particular service against which service
performance may be measured. Service levels usually relate to quality,
quantity, reliability, responsiveness, environmental, acceptability and cost”.
The IIMM notes that the LOS analysis
can be used to:
·
Inform customers of the proposed level of service to be offered;
·
Develop asset management strategies to deliver the required level
of service;
·
Measure performance against defined (current and desired) levels
of service;
·
Identify the costs and benefits associated with the services
offered; and
·
Enable customers to assess the suitability, affordability, and
equity of the services offered.
While these outcomes benefit the
asset management process, they can also benefit other organizational processes,
such as strategic planning, developing master plans, and the budget development
and approval process.
Factors Affecting
Levels of Service
A number of factors may affect the
level of service delivery for a particular asset type. An organization’s policy
objectives, community expectations, legislative requirements, and resource
constraints are some of the factors that generally influence the level of
service. The IIMM provides the following details on some of these factors:
·
Community Expectations: This factor represents one of the
major drivers in setting levels of service. Information is needed about the
community’s expected level of service and willingness to pay for this service. A
balance then needs to be determined between that expected level of service and
its associated costs.
·
Legislative requirements: Legislative standards and
regulations affect the way assets are managed. These requirements stipulate the
minimum levels of service. Therefore, relevant requirements must be taken into
consideration in setting levels of service.
·
Policies and objectives: Existing policies and objectives
should be taken into account when developing levels of service, with care taken
to remain aligned with an organization’s strategic planning documents.
·
Resource availability and financial constraints: These
constraints play a large role in an organization’s ability to provide
sustainable levels of service. Therefore, resource constraints play a
significant part in determining affordable levels of service.
Current vs.
Expected Levels of Service
The concept of comparing current
vs. expected LOS is very important to the overall LOS analysis process and will
be discussed in more detail in a later section, however, it is being introduced
in this section. Current levels of service are essentially the service levels
that are being provided by a municipality at the present time. They can be
defined through qualitative descriptions, lifecycle cost related programs, and/or
performance measures. The current year’s budget reflects the cost of providing
current levels of service. However, the current year’s budget may or may not include
adequate funding to maintain current levels of service over time (more on this
in the performance measures sections). Information on current levels of service
enables an understanding of the difference between the service levels currently
being provided and the service levels expected.
Levels of service are
differentiated between:
·
Community Expectations: Based on what the customer and
community expects to receive;
·
Strategic (or Customer) Levels of Service: Measuring
community expectations against attributes such as reliability, quality, safety,
efficiency, and capacity. Outlines what the customer will receive from a levels
of service standpoint; and
·
Technical Levels of Service: How the organization provides
(or will provide) the levels of service, often using operational or technical
measures.
The Process of
Developing a Level of Service Analysis
The IIMM defines the process for
developing and adopting level of service measures as follows:
Figure 4‑3
IIMM Process for Developing and Adopting Levels of Service
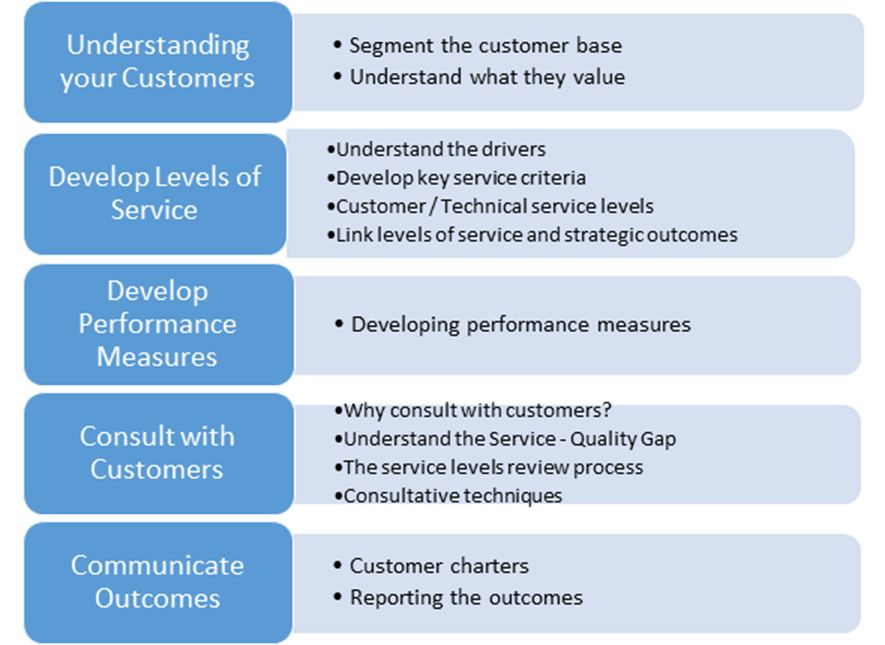
Or, in other words, creating an
LOS analysis can involve:
1. Defining
Customer Expectations
·
Understanding your customer and their wants/needs
2. Developing
Levels of Service
·
Customer vs. technical LOS
·
Current vs. expected LOS
·
Use of performance measures and key performance indicators (KPIs)
3. Consultation,
Communication and Approval
·
Receiving input on the proposed LOS analysis
·
Communicating the LOS analysis to stakeholders
·
Seeking Council approval of the LOS analysis
4. Ongoing
Review, Updates and Improvements
·
Updating the LOS analysis, as needed
Defining Customer Expectations
The process of defining customer
expectations involve any or all of the following:
·
Staff input;
·
Use of industry/local knowledge;
·
Existing reports that refer to customer expectations;
·
Council input; and/or
·
Seeking public input.
Involving Council and/or the
public in the process of defining customer expectations provides a direct
connection between the community and their expectations that may not identified
through other sources. Other sources can involve assumptions and estimations of
customer expectations. Therefore, direct input from the public can be more
accurate, although it requires a more extensive and time-consuming process.
Public input can take many forms, including:
·
Public meetings;
·
Specific workshops or focus groups;
·
Comment submissions; and
·
Surveys or questionnaires.
Developing Levels of Service
To be effective in developing
levels of service, input should be gathered from and communicated to all
interested parties. At this point, the services being provided and the community
expectations should be documented. Using this information, the applicable
departments and staff to include in the LOS discussions can be determined. This
section deals only with the process of developing an LOS analysis, and further detail
on the actual content of that process will be discussed below in other
sections.
Consultation, Communication, and Approval
Once the LOS analysis is complete
in “draft form”, decisions should be made regarding the consultation,
communication, and/or approval processes that need to occur to finalize the
analysis. From a consultation point of view, various stakeholders will be
brought into the process to review the draft LOS analysis and provide feedback.
These stakeholders may include other staff members, Council, and the public. The
approval of the LOS analysis may be simply the discussion and approval at a
Council (or Committee) meeting. A more extensive process may include public
workshops or online videos/reports to communicate the LOS analysis to the public
and Council before it is discussed and approved. A decision on when to approve
the LOS analysis, either as part of an overall asset management plan, or
independently of an asset management plan, will also have to be made. An
independent approval process puts a lot more focus on the LOS analysis than
when noted as part of an overall asset management plan approval discussion. The
additional attention may be useful in getting Council and the public to
understand and buy into the analysis and its conclusions.
Ongoing Review, Updates and Improvements
The establishment of an LOS
analysis is not a one-time occurrence. Rather, it is a constant and evolving
process with ongoing consideration to customer expectations, legislative or
technological requirements/changes, corporate strategic mission and objectives,
and financial opportunities/constraints. It is recommended that municipalities
review their LOS on a periodic basis (see Chapter 8 on Continuous
Improvements). The frequency of these reviews should be established and
followed by staff as part of the Strategic Asset Management Policy (see Chapter
2).
As a municipality moves through
the maturity framework to a desired level, it is expected that the amount of
public input regarding LOS will likely increase. It is important to note that
although seeking public input is important, this input must be considered
taking into account financial considerations. Also, the degree of public input
in the asset management process will depend on the municipality’s capacity to establish
a reasonable and meaningful process.
Establishing LOS targets is often
an iterative process. The process starts with public (community) expectations
of service levels and then measuring these expectations against constraints
such as financial considerations, resourcing and affordability. Only after these
constraints have been taken into account will it be determined whether public
expectations can in fact be approved as expected (target) LOS for the
municipality’s asset management process.

To what extent have community expectations been
documented in the LOS analysis?
Background
One of the first steps in the
development of an LOS analysis determining what services/service levels the
community expects the municipality to provide. While there are different
approaches to gathering and utilizing this information, it should be based on
the service identification process discussed above. As mentioned previously,
community expectations and strategic (customer) levels of service (discussed
later) are documented based on how the customer and community receives the service,
while technical LOS relates to how staff deliver the service.
Levels of Maturity
– Community Expectations
To what extent have community
expectations been documented in the LOS analysis?
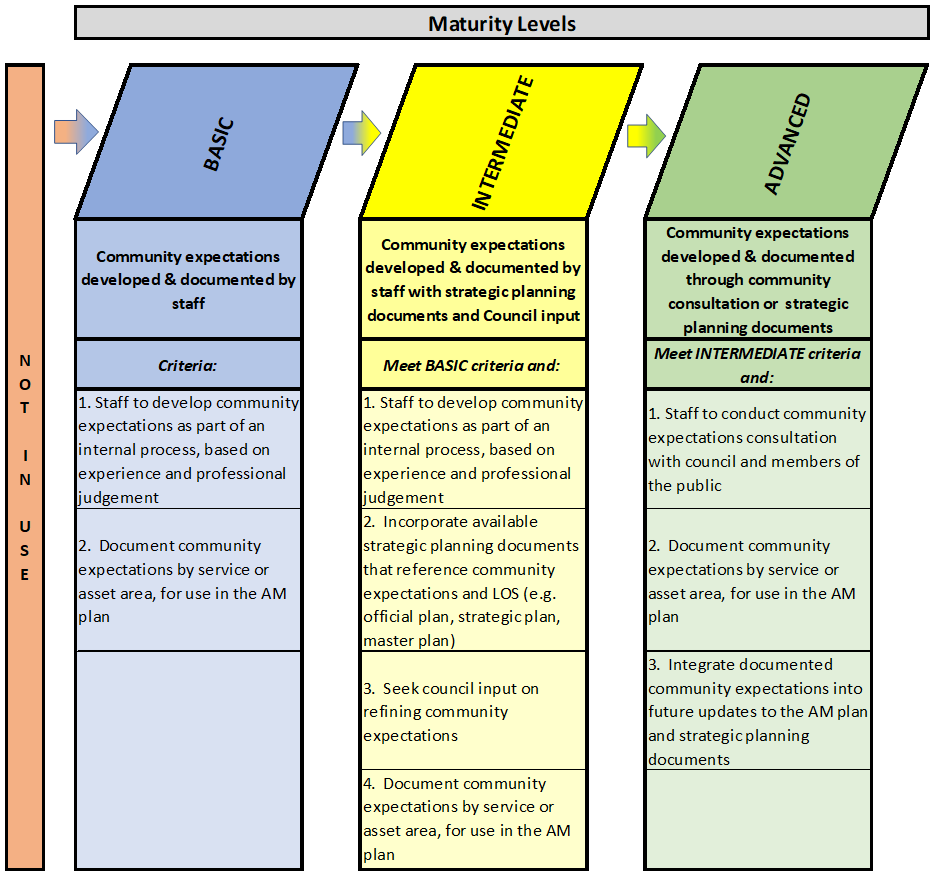
At the basic level of maturity,
community expectations are usually developed by staff, as a result of an
internal (informal) process and based on staff experience and professional
judgment. The community expectations are documented by service/asset area, for
use within the asset management plan.
At the intermediate level of
maturity, staff would still likely develop community expectations, but
incorporate existing strategic planning documents (e.g. official plan,
strategic plan, master plan, etc.). Council input will also be sought and used
to refine community expectations. From this point, community expectations are
documented by service/asset area, for use in the asset management plan.
At the advanced level of
maturity, community consultations are undertaken early in the process,
including Council and members of the public, to identify community
expectations. The community expectations are documented by service/asset area,
for use in the asset management plan. Moving forward, the community
expectations are integrated into future updates to the asset management plan,
as well as other strategic planning documents.
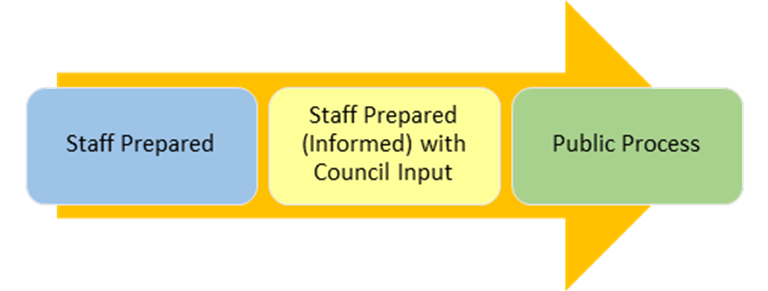
Developing
Community Expectations
The process of developing
community expectations can be as simple as staff completing the process or be
more in depth and include Council and/or the public in the process. In
addition, existing reports, processes, or meeting minutes can be used to inform
the process with more detailed information already known regarding community
expectations. As illustrated in Figure 4-4 (below), there is potential for
increased accuracy in the process and acceptance of the results by Council and
the public as the more complex public process is used.
Figure 4‑4
Approaches to Defining Community Expectations
The customers who are the ultimate
users of the services will have diverse needs and expectations. This
underscores the need to understand the customers and connect their divers needs
to the level of service being provided. It is beneficial to group the users
based on their type and needs when developing community expectations. As part
of this process, the community expectations of the various customer groups will
need to be consolidated for use in the LOS analysis.
The actual process involved in
documenting community expectations is similar, regardless of who is included in
the process. It starts with the identification of services for the municipality
(including applicable capital assets involved in providing that service), and then
documenting what the community expectations are for each service area. The
documentation should be completed in a way that reflects how the community
would communicate expectations. While this sounds simplistic, this process will
have a significant impact on asset management planning as a whole within the
municipality. A misunderstanding of community expectations can result in the
development of an asset management plan that does not meet the needs of the
community.
Expanding on the table of services
discussed previously, the following table provides examples of community
expectations for each service area:
Table 4‑2
Sample Community Expectations
|
Department
|
Services
|
Applicable
Assets
|
Community
Expectations
|
|
Transportation Services
|
Roads
|
Road base, surface, bicycle lanes,
turning lanes, etc.
|
“Smooth roads
that take me where I need to go without too much congestion”
|
|
Bridges and Culverts
|
Structure, deck, surface, etc.
|
“Sturdy
bridges that take me where I need to go without too much congestion”
|
|
Sidewalks
|
Sidewalks
|
“Sidewalks
that I can walk safely on to key areas of the Community”
|
|
Streetlights
|
Poles, fixtures, etc.
|
“Streetlights
that work so I don’t have to walk in the dark”
|
|
Traffic Lights
|
Poles, lights, controllers, etc.
|
“Traffic
lights are placed where needed to ensure smooth and safe traffic flow”
|
|
Transit
|
Vehicles, facilities, equipment, etc.
|
“Access to
public transit to allow me to get where I need to go on a reasonable
schedule”
|
|
Parking
|
Lots, lights, facilities, equipment,
etc.
|
“Safe and
convenient parking is available, where needed”
|
|
Winter Control
|
Vehicles, equipment
|
“Able to
drive on roads safely in winter conditions”
|
|
Environmental
|
Water Distribution
|
Water mains, wells, pumps, towers,
valves, hydrants, etc.
|
“Clean water,
when I need it, that tastes good, has adequate pressure, at a reasonable
cost”
|
|
Water Treatment
|
Treatment plant (treatment systems,
chlorination, pumps, chemical injection and filtration, piping, SCADA, pump
houses, etc.
|
|
Wastewater Collection
|
Mains, pumping systems, manholes, etc.
|
“Wastewater
systems that take my waste away and treats it with no harm to the
environment”
|
|
Wastewater Treatment
|
Treatment plant (separators, aeration
systems, pumps, chemical systems, SCADA, settlement ponds, facilities, etc.)
|
|
Stormwater
|
Urban: Stormwater mains, catch basins,
ponds, headwalls, etc.
|
“No flooding
on our streets or properties”
|
|
Rural: Open ditches, culverts, ponds,
headwalls, etc.
|
|
Solid Waste Collection
|
Vehicles, transfer stations, weigh
scales, containers, etc.
|
“My garbage
and recycling to be picked up each week and processed with no harm to the
environment”
|
|
Solid Waste Disposal
|
Landfills, monitoring wells,
compactors, bulldozers/loaders, etc.
|
|
Solid Waste Diversion
|
Transfer stations, vehicles, containers,
etc.
|
|
Protection Services
|
Fire
|
Vehicles, equipment, facilities,
hydrants, etc.
|
“The fire
department to arrive at emergencies as fast as possible with capable
firefighters”
|
|
Police
|
Vehicles, equipment, facilities, etc.
|
“Police will
respond to emergencies in a timely manner”
|
|
Protective Inspection and Control
|
Vehicles, equipment, facilities, etc.
|
“Ability to
ensure by-laws are being adhered to”
|
|
Recreation and Cultural Services
|
Recreation Facilities
|
Facilities (arenas, pools, community
halls, etc.), vehicles, equipment
|
“Good
recreation facilities to meet the demands of the community”
|
|
“Access to
community halls for community functions”
|
|
Parks
|
Vehicles, equipment, facilities,
active parks, passive parks, etc.
|
“Parks that
are clean, safe, with playgrounds and open fields”
|
|
Libraries
|
Facilities,
equipment, etc.
|
“All facilities should be accessible”
|
|
Museums
|
|
Health Services
|
Public Health/Hospitals
|
Facilities, equipment, etc.
|
“Access to
health services to enhance my quality of life”
|
|
Ambulance Services
|
Facilities, vehicles, equipment,
dispatch equipment, etc.
|
“Properly
equipped ambulance personnel will be dispatched and arrive on-site when
needed”
|
|
Cemeteries
|
Land improvements, facilities,
equipment, etc.
|
“Availability
of a well-maintained and private site for interment needs”
|
|
Social Services and Social Housing
|
Assistance to Aged Persons
|
Facilities, equipment, etc.
|
“Accessible
and well-maintained housing for senior citizens”
|
|
Child Care
|
Facilities, equipment, etc.
|
“Availability
of child care services, so parents can pursue their careers”
|
|
Housing/Co-op/Rent
|
Facilities, equipment, etc.
|
“The
community should support opportunities for independent living”
|
|
Planning and Development Services
|
Residential/Industrial/
Commercial/Agriculture
|
Land, services, etc.
|
“Land should
be made ready for development, as needed”
|
|
General Government
|
Administration
|
Equipment, vehicles, facilities, etc.
|
“A Town Hall that allows me to attend Council meetings,
pay taxes and get my questions answered
|
It is likely that the community will
expect a high level of service in each area, without having an understanding of
the financial consequences of providing that level of service. An opportunity
to improve the public’s understanding of the relationship between service
levels and cost can be added to the ongoing development and refinement of
community expectations. The public will first need to understand a
municipality’s asset management process (as well as the implications of plan
recommendations) before clearly defined expectations can be received from them.
The process of providing the connection between cost and service level will
hopefully assist the public understanding which can be used to revise
documented community expectations. In a later section, the process of outlining
the financial impacts of levels of service will be discussed.
To what extent have strategic (customer) LOS categories
been developed and used?
Background
Strategic (or customer) LOS relates to broad issues such as
overall outcomes or services for the community. They are recorded in a manner
that describes how the customers are receiving the service. This expands on the
community expectations discussed earlier and attempts to describe the levels of
service in terms of what is actually being provided to the customer from a
strategic point of view.
Levels of Maturity – Strategic (Customer) LOS Categories
To what extent
have strategic (customer) LOS categories been developed and used?
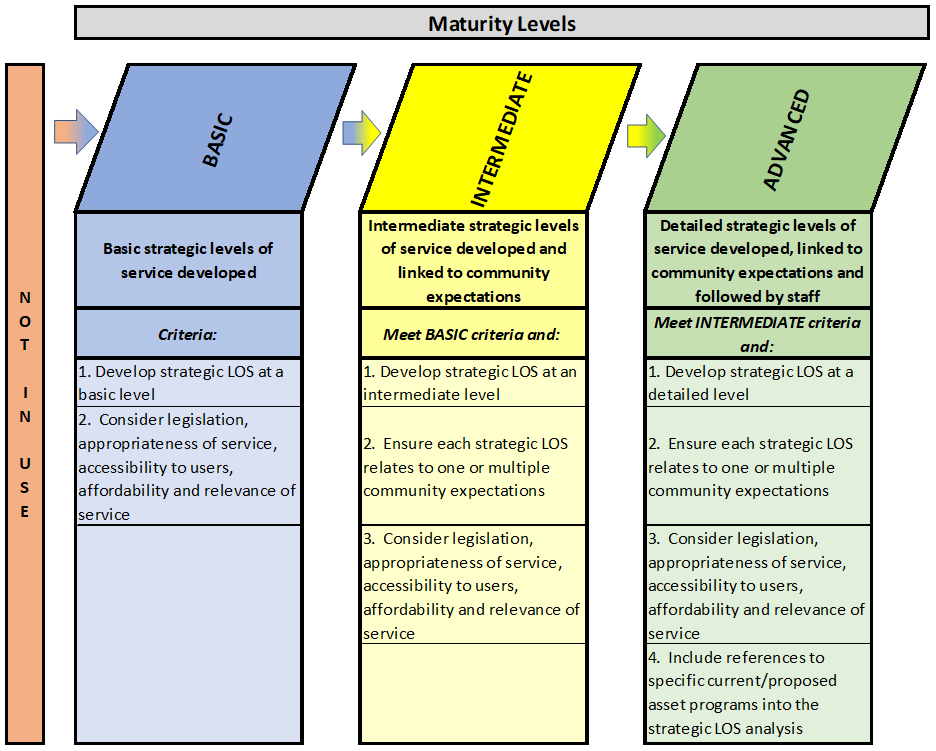
At the basic
level of maturity, strategic (customer) LOS will be developed, but only at
a high-level, with consideration given to key customer outcomes, including
relevant legislation, appropriateness of service, accessibility to users,
affordability and relevance of service. At this level, there is not yet direct
linkage to community expectations (or the community expectations analysis is
incomplete). At a minimum, the legislative requirements outlined in O.Reg
588/17 with respect to customer LOS will be met.
At the intermediate
level of maturity, municipalities will develop strategic (customer) LOS at
a more comprehensive level. Each strategic LOS would be determined with
community expectations taken into account and directly linked to the analysis. As
with the basic level of maturity, key customer outcomes including relevant
legislation, appropriateness of service, accessibility to users, affordability
and relevance of service should also be considered.
At the advanced
level of maturity, detailed strategic LOS will be developed with both
community expectations and customer outcomes taken into account. References to
specific current and/or proposed asset programs that assist in providing the
service will be included in the strategic LOS analysis.
Developing Strategic (Customer) Levels of Service
Strategic LOS (also commonly
referred to as customer LOS) are documented based on how the customer and
community receives the services provided by the municipality. This differs from
technical LOS, which are documented based on how the municipality provides the
services. To clarify, strategic (customer) LOS are from the customer’s
perspective while technical LOS are from the municipality’s perspective.
The overview section
described the ways in which strategic (customer) LOS can be documented and
tracked, including:
· Qualitative
descriptions of services and service levels;
· Identifications
of programs, procedures and/or activities that are required to achieve
particular service levels; and
· Performance
measures or key performance indicators (KPIs) that can illustrate the progression
of service levels (i.e. through trending analysis) and an ultimate objective or
target performance measure/KPI to strive for.
This section focuses on
qualitative descriptions of levels of service. Programs/procedures and
performance measures will be discussed in later sections.
A number of factors may
affect the strategic LOS for a particular asset type. Factors include:
·
Customer expectations;
·
An organization’s policy and
objectives;
·
Legislative requirements; and
·
Resource constraints.
Strategic (customer) LOS
define service levels in relation to a range of attributes, for example:
· Reliability;
· Functionality;
· Quantity;
· Quality;
· Responsiveness;
· Safety;
· Capacity;
· Environmental
impacts;
· Efficiency;
· Affordability;
· Speed;
· Availability;
· Sustainability;
· Appearance;
· Comfort;
and
· Efficiency.
In some cases,
these attributes relate to asset performance, and in other cases they describe
customer benefit. Customer benefit is very much a strategic (customer)
attribute, however, asset performance can be both strategic (customer) LOS and
technical LOS. If the customer directly uses the asset (e.g. roads), then
the performance of that asset is more related to strategic LOS (i.e. how the
customer experiences the service). If, however, the customer does not directly
use the asset (e.g. a snow plow is helping provide safe roads, but the plow
itself is not directly used by the customer), then the performance of that
asset is more related to technical LOS (i.e. how the municipality/staff provide
the service).
The act of defining strategic
LOS can involve consolidating customer expectations for a particular service,
and setting a level of service (using various descriptive attributes) that
attempts to meet customer expectations. Customer expectations are one of the
major drivers in setting levels of service (as discussed above), as it is the
customer expectations that lays the foundation for service levels established
from a strategic point of view. This process can assist in identifying the
customer’s willingness to pay for particular service levels.
Figure 4‑5
Incorporating Community Expectations into LOS

Examples are as follows
(attributes are underlined):
Table 4‑3
Sample Strategic LOS – Expected
|
Services
|
Applicable
Assets
|
Community
Expectations
|
Strategic
LOS Expected (Customer Perspective)
|
|
Roads
|
Road base, surface, bicycle lanes,
turning lanes, etc.
|
“Smooth roads that take me where I
need to go without too much congestion”
|
Safe, reliable roads with adequate capacity
|
|
Bridges and Culverts
|
Structure, deck, surface, etc.
|
“Sturdy bridges that take me where I
need to go without too much congestion”
|
Safe, reliable bridges with adequate capacity
|
|
Sidewalks
|
Sidewalks
|
“Sidewalks that I can walk safely on
to key areas of the Community”
|
Safe sidewalks, access from subdivisions
to downtown
|
|
Streetlights
|
Poles, fixtures, etc.
|
“Streetlights that work so I don’t
have to walk in the dark”
|
Reliable streetlights
|
|
Traffic Lights
|
Poles, lights, controllers, etc.
|
“Traffic lights are placed where
needed to ensure smooth and safe traffic flow”
|
Reliable traffic lights
|
|
Transit
|
Vehicles, facilities, equipment, etc.
|
“Access to public transit to allow me
to get where I need to go on a reasonable schedule”
|
Reliable and convenient transit services
|
|
Parking
|
Lots, lights, facilities, equipment,
etc.
|
“Safe and convenient parking is
available, where needed”
|
Convenient
and secure
parking locations
|
|
Winter Control
|
Vehicles, equipment
|
“Able to drive on roads safely in
winter conditions”
|
Safe roads in winter
|
|
Water
Distribution
|
Water
mains, wells, pumps, towers, valves, hydrants, etc.
|
“Clean water, when I need it, that
tastes good, has adequate pressure, at a reasonable cost”
|
Quality and efficient water supply, with
adequate capacity
|
|
Water Treatment
|
Treatment plant (treatment systems,
chlorination, pumps, chemical injection and filtration, piping, SCADA, pump
houses, etc.
|
|
Wastewater Collection
|
Mains, pumping systems, manholes, etc.
|
“Wastewater systems that take my waste
away and treats it with no harm to the environment”
|
Quality wastewater collection, with adequate capacity
and no environmental impacts
|
|
Wastewater Treatment
|
Treatment plant (separators, aeration
systems, pumps, chemical systems, SCADA, settlement ponds, facilities, etc.)
|
|
Stormwater
|
Urban: Stormwater mains, catch basins,
ponds, headwalls, etc.
|
“No flooding on our streets or
properties”
|
Stormwater
system with adequate capacity
|
|
Rural: Open ditches, culverts, ponds,
headwalls, etc.
|
|
Solid
Waste Collection
|
Vehicles,
transfer stations, weigh scales, containers, etc.
|
“My garbage and recycling to be picked
up each week and processed with no harm to the environment”
|
Responsive and efficient solid waste collection
system
|
|
Solid
Waste Disposal
|
Landfills,
monitoring wells, compactors, bulldozers/loaders, etc.
|
|
Solid Waste Diversion
|
Transfer stations, vehicles, containers,
etc.
|
|
Fire
|
Vehicles, equipment, facilities,
hydrants, etc.
|
“The fire department to arrive at
emergencies as fast as possible with capable firefighters”
|
Responsive and quality fire services
|
|
Police
|
Vehicles, equipment, facilities, etc.
|
“Police will respond to emergencies in
a timely manner”
|
Responsive and quality police services
|
|
Protective Inspection and Control
|
Vehicles, equipment, facilities, etc.
|
“Ability to ensure by-laws are being
adhered to”
|
Responsive and quality inspection services
|
|
Recreation Facilities
|
Facilities (arenas, pools, community
halls, etc.), vehicles, equipment
|
“Good recreation facilities to meet
the demands of the community”
|
Adequate quantity and quality
of recreation facilities
|
|
“Access
to community halls for community functions”
|
Reliable, safe community halls
|
|
Parks
|
Vehicles, equipment, facilities,
active parks, passive parks, etc.
|
“Parks that are clean, safe, with
playgrounds and open fields”
|
Adequate quantity
and quality of parks
|
|
Libraries
|
Facilities,
equipment, etc.
|
“All
facilities should be accessible”
|
Safe and functional facilities
|
|
Museums
|
|
Public Health/Hospitals
|
Facilities, equipment, etc.
|
“Access to health services to enhance
my quality of life”
|
Available, quality health care
|
|
Ambulance Services
|
Facilities, vehicles, equipment,
dispatch equipment, etc.
|
“Properly equipped ambulance personnel
will be dispatched and arrive on-site when needed”
|
Reliable, responsive ambulance service
|
|
Cemeteries
|
Land improvements, facilities,
equipment, etc.
|
“Availability of a well-maintained and
private site for interment needs”
|
Available, well-maintained cemeteries
|
|
Assistance to Aged Persons
|
Facilities, equipment, etc.
|
“Accessible and well-maintained
housing for senior citizens”
|
Available, functional housing for senior
citizens
|
|
Child Care
|
Facilities, equipment, etc.
|
“Availability of child care services,
so parents can pursue their careers”
|
Available, safe child care service locations
|
|
Housing/Co-op/Rent
|
Facilities, equipment, etc.
|
“The community should support
opportunities for independent living”
|
Available, functional assisted living facilities
|
|
Residential/Industrial/
Commercial/Agriculture
|
Land, services, etc.
|
“Land should be made ready for
development, as needed”
|
Available serviced land for development
|
|
Administration
|
Equipment, vehicles, facilities, etc.
|
“A Town Hall that allows me to attend
Council meetings, pay taxes and get my questions answered
|
Safe and functional equipment and
facilities
|
While
the examples in the table above are high level, further descriptions can be
included in the identification of the strategic (or customer) LOS, such as
expanding on:
·
How these service attributes (e.g.
reliability, functionality, etc.) will be provided to customers; and
·
Breaking down community
expectations by defined customer groups.
Table 4-4 (below) is an
example of linking the services being provided to the assets providing the
service, the defined customer groups impacted by the service and the strategic
(customer) LOS established. This example labels the service being provided at a
higher level, as “Transportation Services”.
Table 4‑4
Linking Services, Assets, Customers, and Strategic LOS
|
Service
|
Asset Type
|
Various Customer Groups
|
Strategic (Customer) LOS
|
|
Transportation Services
|
Road Network
|
· Drivers
of private vehicles
·
Drivers of public or commercial vehicles
·
Motorcyclists
·
Local residents
·
Commercial
·
Commuters
·
Visitors / tourists
·
Emergency Services / Police
·
Pedestrians
·
Cyclists
·
Recreational use
|
·
Safe, comfortable and efficient
transportation system
·
Safe journey
·
Smooth ride and clear directions
·
Efficient, safe, and cost-effective
transport of goods and services to and from customers
·
Cost effective transportation options
·
Safe access and parking
|
The
IIMM identifies a number of important
items to consider when identifying customer service levels:
· All
significant activities for each service should be covered;
· The
number of service criteria should be manageable and appropriate to the quality
and availability of the financial and service level data;
· Service
criteria should be recognizable, meaningful and assist the organization to
achieve its goals; and
· Levels
of service should consider: quality, quantity, safety, capacity, fitness for
purpose, aesthetics, reliability, responsiveness, environmental acceptability,
and cost.
As previously mentioned strategic (customer) LOS
relates to how the customer receives the service, in terms of both tangible and
intangible measures and criteria. Further examples of tangible measures that
relate specifically to the customer include:
· Appearance
of assets (e.g. facilities);
· Frequency
of service disruptions;
· Accessibility
to users (e.g. 24 hours a day, 7 days a week);
· Availability
of a service; and
· Incidences
of illness or injury.
Examples of intangible measures include:
· Appropriateness
of service;
· Affordability;
· Relevance
of the service being provided in terms of demand characteristics, future
demographics, current back-logs and where the pressure points are;
· Speed
of service; and
· Attitude
and ease of dealing with the municipality.
At a strategic
level, LOS will generally apply to a generic service, class or large grouping
of assets and have a long-term focus. As such, they should refer to levels of
services that apply to the whole of that service or asset class. Alternatively,
strategic LOS can be set based on specific categories of assets within that
class. For example, a municipality may set strategic LOS for water services as “to
provide quality and efficient water supply, with adequate capacity”.
This generic LOS statement applies to all water supply. If the municipality
wanted to break down “water supply” into smaller service categories (e.g.
residential vs. non-residential water supply, or large diameter mains vs.
smaller diameter mains), specific levels of service could be defined at that
level, if there were differing statements to make about LOS in each category.
In order to better understand
the community’s expectations and limitations related to levels of service, it
can be beneficial to complete a public consultation process. This process will
help identify customer expectations, can help link these expectations to
strategic (customer) LOS within the LOS analysis, and assist in educating the
public on the financial implications of providing particular levels of service.
A balance can then be made between the expected LOS and cost.
O.Reg 588/17
The IJPA through O.Reg 588/17
has incorporated some mandatory customer (community) based descriptions for
core infrastructure asset categories. As these descriptions are connected with
mandatory performance metrics that are to be reported on in a municipality’s AM
plan, both have been provided in the Performance Measures section below (see
Table 4-15).

To what extent are current levels of service compared to
expected levels of service at a strategic (customer) level?
Background
One of the ultimate goals of
asset management planning is to move to (or towards) expected LOS. To evaluate
the level of success of the asset management planning process from a level of
service perspective, a comparison of current LOS to expected LOS is needed. In
this manner, municipalities can identify areas of success, and assess where
improvements are required, how to move to expected LOS, and at what cost.
Levels of Maturity: Current LOS vs. Expected LOS at Strategic
Level
To what extent
are current LOS compared to expected LOS at a strategic level?
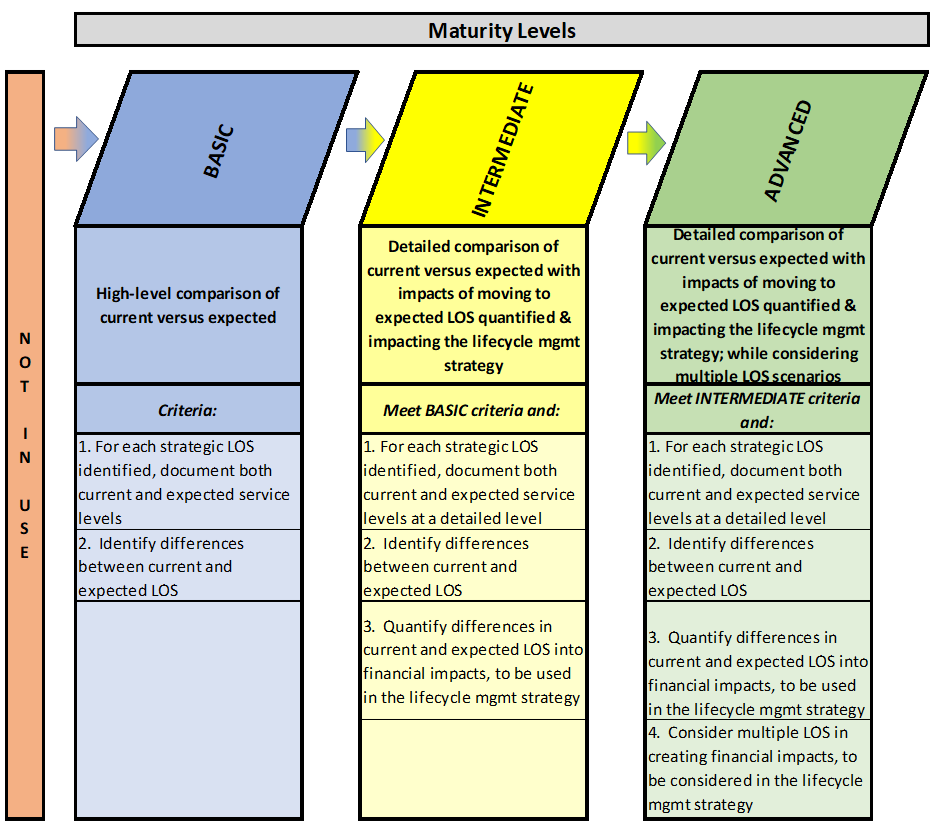
At the basic
level of maturity, municipalities will undertake a high-level comparison of
current versus expected strategic LOS at the strategic (customer) level. The
comparison is predominantly qualitative (through the use of descriptions) and the
results and differences are identified and documented for use in the LOS
analysis. At a minimum, the legislative requirements outlined in O.Reg 588/17
with respect to customer LOS will be met.
At the intermediate
level of maturity, the differences between current and expected strategic
LOS are also quantified into asset lifecycle impacts as well as financial
impacts, and the results carried forward for implementation within the
lifecycle management strategy (see Chapter 5).
At the advanced
level of maturity, municipalities complete the additional step of
considering multiple LOS when quantifying financial impacts, and consider the
results within the lifecycle management strategy scenarios (see Chapter 5).
Comparing Current LOS to Expected LOS (Strategic)
As outlined earlier in this
chapter, a strategic LOS analysis includes:
· An
identification of existing LOS;
· A
determination of expected (or desired) LOS; and
· An
assessment of the implications of moving from existing LOS to expected
(desired) LOS over a forecast period.
Therefore, if
current LOS equates to what service level is currently provided, expected LOS
outlines the overall objective or target LOS to be reached at some point in
time. The amount of time it will take to reach expected LOS depends on the
assumptions a municipality makes within the asset management planning process. Using
different assumptions will lead to multiple scenarios and multiple timelines
within the within the lifecycle management strategy. For example, a
municipality could decide to meet expected LOS in a particular area in 10
years. When that scenario is assessed within the Lifecycle Management Strategy
(see Chapter 5) and the Financing Strategy (see Chapter 6) and concluded to be
too expensive too quickly, the LOS analysis can be updated to include another
scenario to reach expected LOS in 15 or 20 years. Alternate scenarios can also
represent different (e.g. higher or lower) levels of service.
Figure 4‑6
Strategic LOS Analysis Process
This section deals
specifically with the comparison of current and expected LOS from a strategic
(customer) perspective and the associated financial implications. While the
financial implications are considered in other sections of the asset management
plan, identifying gaps in service levels, and understanding how they impact the
customer, is critical in assessing these implications within the proper context.
Table 4-5 (below) illustrates a high-level comparison of expected LOS
(developed in earlier sections) to current LOS. This comparison can support an
action plan that outlines what has to be done in order to move towards expected
LOS. As noted earlier, the amount of time it takes to implement the action plan
and the level of service defined as expected plays a role in assessing the
overall financial implications of the LOS analysis. Therefore, both the amount
of time and the level of service can be adjusted through the use of multiple
LOS scenarios.
Table 4‑5
Sample Current Strategic LOS and Action Plans
|
Services
|
Strategic
LOS Expected (Customer Perspective)
|
Current
LOS
|
Action
Plans
|
|
Roads
|
Safe, reliable roads with
adequate capacity
|
Roads mostly safe and reliable, with some
capacity issues
|
Increased rehabilitation and expansion
program
|
|
Bridges and Culverts
|
Safe, reliable
bridges with adequate capacity
|
Bridges
mostly safe and reliable, with some capacity issues
|
Increased
rehabilitation and expansion program
|
|
Sidewalks
|
Safe
sidewalks, access from subdivisions to downtown
|
Safe
sidewalks, access from most subdivisions to downtown
|
New sidewalk
expansion program
|
|
Streetlights
|
Reliable streetlights
|
Reliable
streetlights
|
LED program
|
|
Traffic Lights
|
Reliable traffic lights
|
Reliable
traffic lights
|
N/A
|
|
Transit
|
Reliable and convenient transit services
|
Transit
services mostly reliable and convenient
|
Increased
inspection and maintenance
|
|
Parking
|
Convenient and secure parking locations
|
Parking
locations convenient and secure
|
N/A
|
|
Winter Control
|
Safe
roads in winter
|
Roads safe in
winter
|
N/A
|
|
Water
Distribution
|
Quality
and efficient water supply, with adequate capacity
|
Quality and
efficient water supply, with adequate capacity
|
Water Rate
Study
|
|
Water Treatment
|
|
Wastewater Collection
|
Quality
wastewater collection, with adequate capacity and no environmental impacts
|
Quality
wastewater collection, with adequate capacity and no environmental impacts
|
Wastewater
Rate Study, Inflow and Infiltration Inspections
|
|
Wastewater Treatment
|
|
Stormwater
|
Stormwater system with adequate capacity
|
Stormwater
system with adequate capacity
|
N/A
|
|
Solid
Waste Collection
|
Responsive and efficient solid waste collection system
|
Responsive
and efficient solid waste collection system
|
N/A
|
|
Solid
Waste Disposal
|
|
Solid Waste Diversion
|
|
Fire
|
Responsive and quality fire services
|
Responsive
and quality fire services
|
N/A
|
|
Police
|
Responsive and quality police services
|
Responsive
and quality police services
|
N/A
|
|
Protective Inspection and Control
|
Responsive and quality inspection services
|
Responsive
and quality inspection services
|
N/A
|
|
Recreation Facilities
|
Adequate quantity and quality of recreation
facilities
|
Adequate quality of recreation facilities
and parks, arenas beyond full capacity
|
Additional ice pad
|
|
Reliable,
safe community halls
|
Reliable, safe
community halls
|
N/A
|
|
Parks
|
Adequate quantity and quality
of parks
|
Adequate quantity
and quality of parks
|
N/A
|
|
Libraries
|
Safe and functional facilities
|
Safe and functional facilities, however, not accessible
|
Accessibility program
|
|
Museums
|
|
Public Health/Hospitals
|
Available, quality health care
|
Available,
quality health care
|
N/A
|
|
Ambulance Services
|
Reliable, responsive ambulance service
|
Reliable,
responsive ambulance service
|
N/A
|
|
Cemeteries
|
Available, well-maintained cemeteries
|
Available,
well-maintained cemeteries
|
N/A
|
|
Assistance to Aged Persons
|
Available, functional housing for senior citizens
|
Available,
functional housing for senior citizens
|
N/A
|
|
Child Care
|
Available, safe child care service locations
|
Available,
safe child care service locations
|
N/A
|
|
Housing/Co-op/Rent
|
Available, functional assisted living facilities
|
Available,
functional assisted living facilities, however, upgrades required to meet new
fire safety standards
|
N/A
|
|
Residential/Industrial/
Commercial/Agriculture
|
Available serviced land for development
|
Available
serviced land for development
|
N/A
|
|
Administration
|
Safe
and functional equipment and facilities
|
Safe and
functional equipment and facilities
|
Upgrade
non-compliant
|
In Table 4‑5 above, action
plan items can be further detailed in terms of timing and costing. For example:
Table 4‑6
Sample Strategic Action Plan Scenarios
|
Action Item
|
Scenario 1
|
Scenario 2
|
Scenario 3
|
|
New Sidewalk Expansion
Program
|
Both sides of
street, in 5 years:
$100,000 per year
|
One side of street,
in 5 years:
$50,000 per year
|
One side of street,
in 10 years:
$25,000 per year
|
These scenarios can be used to
educate Council and the public on the relationship between levels of service,
and costs to provide expected LOS.
Action items can include:
·
Non-infrastructure items;
·
Maintenance items;
·
Rehabilitation items/programs;
·
Replacement items/programs; and/or
·
Expansion items/programs.
Costing Levels of Service Action Plans
The following are required in
order to cost levels of service action plans:
a)
Well-defined levels of service scenarios and respective action plan
items;
b)
A clearly defined action plan, including what is needed, where it is
needed and why;
c)
A process of determining costs and unit rates associated with that action
plan; and
d)
Accurate cost information.
When including action items
within the LOS analysis, municipalities should be mindful of:
· The
total cost of implementing the action plan;
· The
impact the action plan has on the future lifecycle costs of the applicable
assets (more on this in Chapter 5); and
· The
impact of the action plan items on projected LOS over the forecast period.
To what extent have technical LOS categories been
developed and used?
Background
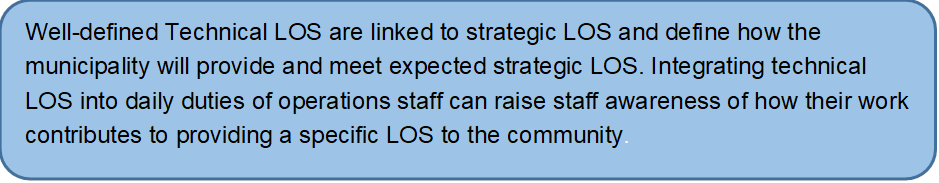
Technical LOS
outline, from a municipal perspective, the services and service levels provided
(and to be provided) to the community. This differs from strategic (customer)
LOS which are more from the customer’s point of view. Technical LOS should be
developed and linked to the strategic (customer) LOS as well as the overall
customer expectations. Technical LOS will generally be more specific than
strategic LOS, relating more to the roles and responsibilities of municipal
staff as well as how technical LOS differ within each broad asset category.
Levels of Maturity – Technical LOS Categories
To what extent
have technical LOS categories been developed and used?
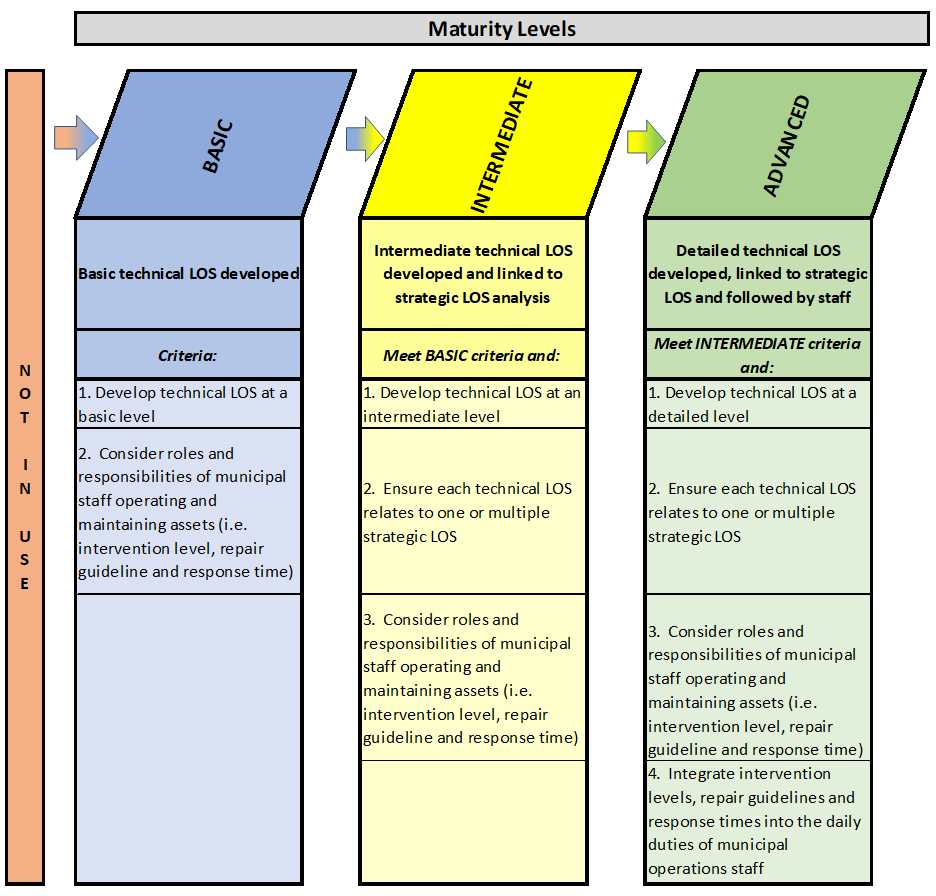
At the basic
level of maturity, technical LOS are developed but only at a high level. Consideration
is given to roles and responsibilities of municipal staff that operate and
maintain assets and provide the services (i.e. intervention levels, repair
guidelines and response times). At a minimum, the legislative requirements
outlined in O.Reg 588/17 with respect to technical LOS will be met.
At the intermediate
level of maturity, municipalities will develop technical LOS at a more
detailed level. Each technical LOS would be considered in relation to one or
more strategic (customer) LOS. Consideration would be given to roles and
responsibilities of municipal staff operating and maintaining assets.
At the advanced
level of maturity, intervention levels, repair guidelines and response
times are alo integrated into the daily duties of municipal operations staff. At
this level of maturity, operational staff are aware of their contribution to
providing levels of service to the community.
Developing Technical Levels of Service
The discussion on strategic (customer) LOS was at a high level in the
previous sections, with broad service and asset categories. For example, roads
were grouped together into one category, with the following levels of service
expectations:
· Community Expectations: “Smooth roads that take me where I
need to go without too much congestion”; and
· Strategic
(Customer) LOS: “Safe, reliable roads with adequate capacity”.
Technical LOS are documented
in the same manner as strategic (customer) LOS, including:
· Qualitative
descriptions of services and service levels;
· Identifications
of programs, procedures and/or activities that are required to achieve
particular service levels; and
· Performance
measures or key performance indicators (KPIs) that can illustrate the
progression of service levels (i.e. through trending analysis) and an ultimate
objective or target performance measure/KPI to strive for.
This section focuses on the qualitative descriptions and
programs needed from a LOS perspective. Performance measures are discussed in
later sections.
While the documented
structure is similar to strategic (customer) LOS, the focus for measurement has
now shifted to the municipality and municipal staff. In setting technical LOS, we
will think of service levels from this perspective:
·
What is being done by the
municipality to provide current LOS?
·
What has to be done in the future
in order to provide expected LOS?
·
Are there performance measures
that can assist in describing technical LOS?
Also, similar to strategic
(customer) LOS, technical LOS define service levels in relation to a range of attributes,
such as:
· Reliability;
· Functionality;
· Quantity;
· Quality;
· Responsiveness;
· Safety;
· Capacity;
· Environmental
impacts;
· Efficiency;
· Affordability;
· Speed;
· Availability;
· Sustainability;
· Appearance;
· Comfort;
and
· Efficiency.
As discussed in
the strategic (customer) LOS section, in some cases these attributes (ab0ve) relate
to asset performance, and in other cases they describe customer benefit.
Customer benefit is very much a strategic (customer) attribute. However, asset
performance can relate to both strategic (customer) LOS and technical LOS. If the customer directly uses the asset (e.g. roads), then
the performance of that asset is more related to strategic LOS (i.e. how the
customer experiences the service). If the customer does not directly use the
asset (e.g. a snow plow helping to provide safe roads, but the plow is not
directly used by the customer), then the performance of that asset is more
related to technical LOS (i.e. how the municipality/staff provide the service).
Technical levels of service can relate to:
· Legislative
compliance;
· Levels of functionality;
· Levels of financial return or asset cost;
· Reduction in the dependency for new asset solutions;
· Specific lifecycle costs (maintenance, rehabilitation, replacement,
expansion);
· Levels of asset condition; and
· Risk and safety.
Specifically, technical
levels of service are detailed objectives that normally relate to specific services,
assets or activities. These may include such things as:
·
Design standards;
·
Maintenance
intervention levels;
·
Response times;
·
Work activity standards;
and/or
·
Asset condition
standards.
Each technical
level of service is intended to ensure a particular service standard is met
from a municipal or staff perspective (i.e. what an organization has to do). For
example, at what point will we repair, renew or upgrade to meet the strategic
(customer) LOS?
When it comes to technical
LOS, it now has to be determined how municipal staff will provide this level of
service. What’s more, “how” may differ, depending on the road type, for example.
Roads can be classified into classes or categories such as
rural/semi-urban/urban or local/collector/arterial or even paved/unpaved. The
technical LOS for each category may be different. For example, the attributes
“safe”, “reliable”, and “adequate capacity” were used to describe strategic
LOS. To some municipalities, these attributes can be provided by staff to all
roads using the same maintenance, rehabilitation and replacement programs.
However, many municipalities will consider an urban or arterial road to have a
“higher” level of service than a rural or local road. In many ways, this comes
back to the consequence of failure discussions outlined in Chapter 3. The
consequence of failure for an arterial road that handles much more traffic at
faster speeds is higher than the consequence of failure of a local road with
much less traffic and reduced speeds. Differing consequences can result in
differing levels of service. Going back to our road example above, providing
“safe”, “reliable” and “adequate capacity” roads could mean differing action
plans depending on the type of road (and the risks associated with that road).
Examples for
various asset categories are provided in the table below:
Table 4‑7
Example of Varying Technical LOS Levels
|
Strategic LOS
Level
|
Technical LOS
Level
|
|
Roads and Bridges
|
·
Local, Collector,
Arterial
·
Rural, Semi-Urban,
Urban
·
MMS classes
1,2,3,4,5,6
·
Traffic ranges
(High, Med, Low)
·
By replacement cost
(high value, medium value, low value)
|
|
Mains (Water, Wastewater, Storm)
|
·
Residential,
Non-Residential
·
By diameter (Small,
Med, Large)
·
By replacement cost
(high value, medium value, low value)
|
|
Solid Waste
|
·
By replacement cost
(high value, medium value, low value)
|
|
Facilities
|
·
By replacement cost
(high value, medium value, low value)
·
By the type of
service being provided (high, med, low critical service)
|
|
Vehicles and Equipment
|
·
By replacement cost
(high value, medium value, low value)
·
By the type of
service being provided (high, med, low critical service)
|
|
Land Improvements
|
·
By replacement cost
(high value, medium value, low value)
·
By the type of
service being provided (high, med, low critical service)
|
One approach to
identifying the correct service or asset breakdown in defining levels of
service is to review maintenance, rehabilitation and replacement decisions by
asset category.
· Do you perform the exact same maintenance on all roads or does it
differ depending on the road type?
· Do you schedule rehabilitation and replacement needs the exact same
on all roads or does it differ depending on the road type?
If you perform these lifecycle activities based
on a different level or frequency, for example, on arterial roads in comparison
to local roads, there is a good chance that LOS should be defined differently
for each.
Table 4‑8
Sample Expected Technical LOS
|
Services
|
Strategic
LOS Expected
(Customer
Perspective)
|
Technical
LOS Expected
(Staff Perspective)
|
|
Roads
|
Safe, reliable roads with
adequate capacity
|
Average condition rating: Local (5/10),
Collector (6/10), Arterial (7/10)
|
|
Follow Minimum Maintenance Standards
|
|
Bridges and Culverts
|
Safe, reliable
bridges with adequate capacity
|
Average condition
rating: 7/10
|
|
Follow
Minimum Maintenance Standards
|
|
Sidewalks
|
Safe
sidewalks, access from subdivisions to downtown
|
Average
condition: 7/10
|
|
Minimize
complaints
|
|
Streetlights
|
Reliable streetlights
|
Minimize
complaints
|
|
Traffic Lights
|
Reliable traffic lights
|
Minimize
complaints
|
|
Transit
|
Reliable and convenient transit services
|
Inspect and perform maintenance on vehicles monthly
|
|
Minimize
complaints
|
|
Parking
|
Convenient and secure parking locations
|
Minimize
complaints
|
|
Winter Control
|
Safe
roads in winter
|
Follow MMS
|
|
Water
Distribution
|
Quality
and efficient water supply, with adequate capacity
|
Meet
legislative requirements
|
|
Water Treatment
|
Unaccounted
for water under 30%
|
|
Less than 5
main breaks annually, per 100 customers
|
|
Wastewater Collection
|
Quality
wastewater collection, with adequate capacity and no environmental impacts
|
Meet
legislative requirements
|
|
Minimize
incidents of bypass
|
|
Wastewater Treatment
|
Less than 5
main breaks annually, per 100 customers
|
|
Stormwater
|
Stormwater system with adequate capacity
|
Minimize
flooding incidents per 1,000 people
|
|
Solid
Waste Collection
|
Responsive and efficient solid waste collection system
|
Minimize
complaints
|
|
Solid
Waste Disposal
|
Inspect and
perform maintenance on vehicles monthly
|
|
Solid Waste Diversion
|
|
Fire
|
Responsive and quality fire services
|
Minimize
response times
|
|
Meet
legislative requirements
|
|
Follow
vehicle and equipment replacement program
|
|
Police
|
Responsive and quality police services
|
Minimize
response times
|
|
Meet
legislative requirements
|
|
Follow
vehicle and equipment replacement program
|
|
Protective Inspection and Control
|
Responsive and quality inspection services
|
Follow
vehicle and equipment replacement program
|
|
Recreation
Facilities
|
Adequate quantity and quality
of recreation facilities
|
Utilization
percentages for all facilities to be between 80% and 100%
|
|
Reliable,
safe community halls
|
Follow facility
maintenance program
|
|
Minimize
complaints
|
|
Parks
|
Adequate quantity and quality
of parks
|
Provide 1 park
per 1,000 residents
|
|
Libraries
|
Safe and functional facilities
|
100% of facilities to pass accessibility standards
|
|
Museums
|
|
Public Health/Hospitals
|
Available, quality health care
|
Meet
legislative requirements
|
|
Follow
facility maintenance program
|
|
Ambulance Services
|
Reliable, responsive ambulance service
|
Minimize
response times
|
|
Meet
legislative requirements
|
|
Follow
vehicle and equipment replacement program
|
|
Cemeteries
|
Available, well-maintained cemeteries
|
Minimize
complaints
|
|
Assistance to Aged Persons
|
Available, functional housing for senior citizens
|
Meet
legislative requirements
|
|
Follow
facility maintenance program
|
|
Child Care
|
Available, safe child care service locations
|
Meet
legislative requirements
|
|
Follow
facility maintenance program
|
|
Housing/Co-op/Rent
|
Available, functional assisted living facilities
|
Meet
legislative requirements
|
|
Follow
facility maintenance program
|
|
Residential/Industrial/
Commercial/Agriculture
|
Available serviced land for development
|
Minimize
complaints
|
|
Administration
|
Safe
and functional equipment and facilities
|
Minimize
complaints
|
Expanding on the
examples in the table above, technical LOS can be detailed in a manner to
assist municipal staff from a day-to-day operational perspective. For example,
“minimizing complaints” can be expanded to include how to deal with complaints,
such as:
· Staff will respond to customer complaints within X hours;
· Staff will perform required maintenance on assets within Y days; and
· Staff will provide a response to complaints within Z hours.
It is also important to point out that many
of the technical LOS illustrated in the table above refer to a service that can
be measured through a key performance indicator or performance measure. For
example, a technical LOS objective for water is to have “unaccounted for water
under 30%”. This is a performance measure that not only can be measured each
year, but can also be analysed over many years to indicate in what direction
this measure is trending (e.g. upwards, downwards or staying consistent). This
becomes important when discussing performance measures in a later section.
To what extent are technical levels of service followed
by operational staff?
Background
Operational staff play a key role in providing various
services within a municipality. The day-to-day activities of these staff
contribute to the overall goals and objectives of their individual divisions
and departments. They also contribute to the goals and objectives of the
organization as a whole as outlined in the municipality’s strategic planning
document. Linking these operational activities to the technical LOS analysis
provides a direct connection between the levels of service being provided (or
expected to be provided) and the effort (time, resourcing, cost, etc.) from the
operational staff to provide those service levels.
Levels of Maturity
To what extent are
technical levels of service followed by operational staff?

At the basic level of maturity, operational staff
will have a high-level understanding of the technical LOS established as part
of the AM planning process. This will be in the form of a high-level
educational process as well as communication to relay updated results (i.e. actual
technical LOS results) a few times a year.
At the intermediate level of maturity, operational
staff will have a more detailed understanding of technical LOS established
within the municipality. At this level, operational staff participate in
measuring technical LOS on an annual basis.
At the advanced level of maturity, operational staff
will have their day-to-day duties linked to the technical LOS within their
department. In addition, there is a direct connection between the technical LOS
and goals and objectives of the employees, the department/division and the
organization as a whole.
Operational Activities and Technical Levels of Service
Technical LOS was discussed in detail in the previous
section. This section relates to the integration of these technical LOS into
the activities performed by operational staff. This integration allows for the
ability to relate the actions of staff to the over-arching goals and objectives
of the department, or even the organization as a whole. This can provide an
approach to evaluating staff performance in meeting these goals/objectives.
What’s more, having operational staff educated and informed on technical LOS
established within the AM planning process provides additional benefits, such
as staff “buy-on” on the AM process.

Do you have a strategy in place to determine when and how
service capacity assessments are updated?
Background
Service capacity
data provides critical information on municipal assets, as it relates to the
maximum service each asset can provide in its current state. Having this data
updated on a consistent basis assists in providing service levels at expected
levels.
Levels of Maturity
Do you have a strategy in
place to determine when and how service capacity assessments are updated?
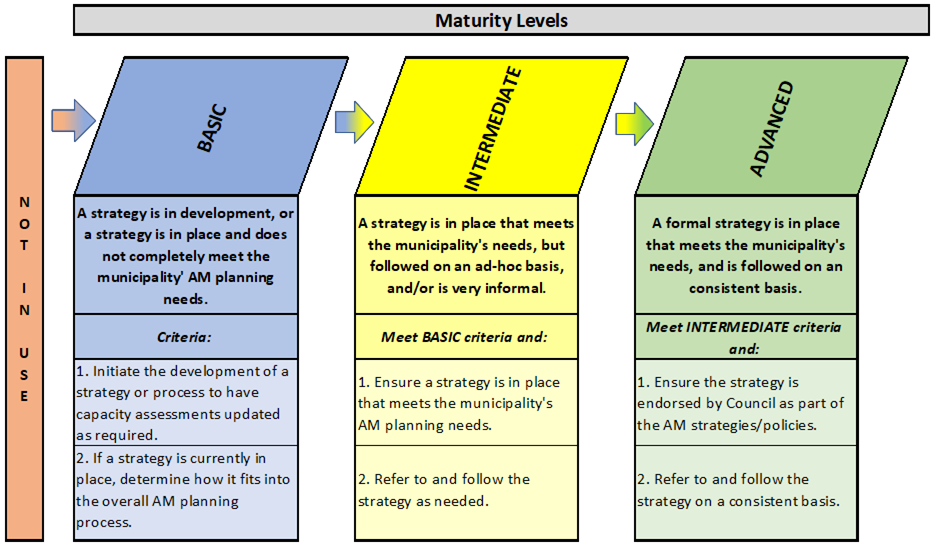
At the basic level of maturity, municipalities
initiate the development of a strategy or process to have capacity assessments
updated, as required. If a strategy is currently in place, municipalities at
this level will need to determine how it fits into the overall asset management
planning process.
At the intermediate level of maturity, municipalities
ensure a strategy is in place that meets its asset management planning needs
and refer to it as needed.
At the advanced level of maturity, municipalities
ensure the strategy is endorsed by Council and refer to it on a consistent
basis.
Updating Service Capacity Assessments
As described above, an asset’s service capacity refers to
the “maximum output” an asset can provide on a consistent basis. Examples are
as follows:
·
Roads & Bridges: Traffic Volumes;
·
Water, Wastewater & Storm: Flows;
·
Solid Waste: Utilization or
storage capacity;
·
Vehicles/Equipment: Kilometers or hours;
As time passes, or as assets are used or improved, their
service capacities may also change. This makes the service capacity attribute
as important to update as the condition rating or replacement cost of the
asset.
A strategy or process to follow to ensure service capacity
data remains accurate and consistent ensures that this information can be
relied upon within the asset management planning process. This process can be
as simple as the need to reassess or recalculate service capacity annually, in
addition to when significant events (i.e. asset addition, disposal,
improvement, and write-off) occur.
To what extent is service capacity data used to determine
asset remmaining life and future lifecycle costs?
Background
Incorporating service capacity data within the technical LOS
analysis provides critical information to assess asset remaining life and
future lifecycle costs required. As discussed in Chapter 3, an asset can “fail”
based on its condition, but also based on not providing the needed capacity to
provide a service.
Levels of Maturity
To what extent is service
capacity data used to determine asset remaining life and future lifecycle
costs?

At the basic level of maturity, municipalities use service
capacity data for more significant assets.
At the intermediate level of maturity, municipalities use service
capacity data for most assets.
At the advanced level of maturity, municipalities use service
capacity data for all assets.
Use of Service Capacity Data
Service capacity data can be used within the AM planning
process in many ways, including:
·
It is an asset attribute that can be maintained within a
municipality’s asset register (see Chapter 3);
·
It can form part of the “risk” calculation discussed in Chapter
3;
·
Can form part of the level of service analysis (i.e. technical
LOS) discussed within this chapter, including the tracking and trending of this
data to determine if assets can provide services at desired levels (see the
performance measures section below); and
·
It can be a direct criteria within the Lifecycle Management
Strategy (Chapter 4) to determine timing of lifecycle costs. For example, an
asset rehabilitation can be accelerated within the forecast period due to the
fact that the current service capacity will not sustain desired service levels.
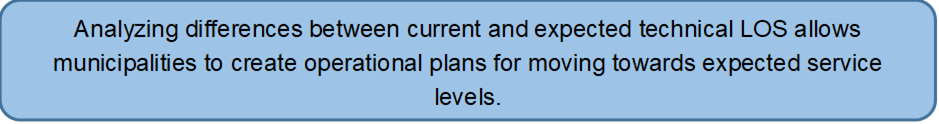
To what extent are you comparing current LOS to expected LOS
at a technical level?
Background
Comparing current LOS to
expected LOS at the technical level not only provides a mechanism to outline
action plans to move towards expected LOS, but also assists the municipality
from an operation perspective, by outlining what has to occur at a staff level
to meet expected service levels.
Levels of Maturity: Current LOS vs. Expected LOS (Technical)
To what extent
are you comparing current LOS to expected LOS at a technical level?
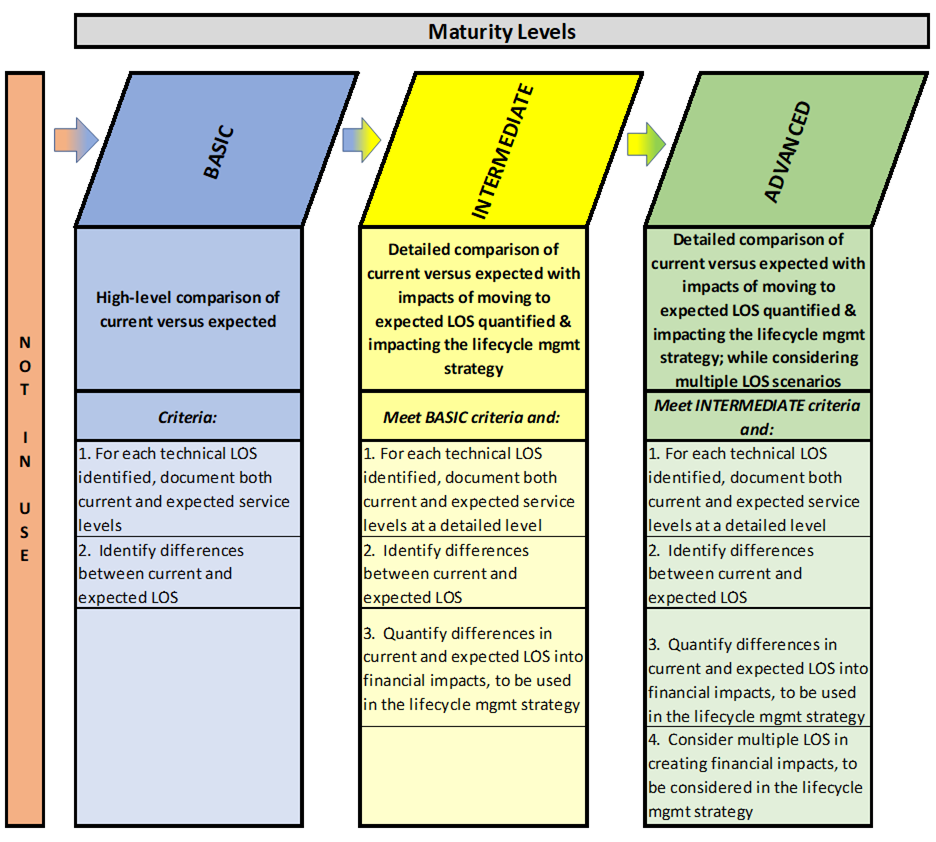
At the basic
level of maturity, municipalities undertake a high-level comparison of
current versus expected technical LOS. The results and differences should be
identified and documented within the LOS analysis. At a minimum, the
legislative requirements outlined in O.Reg 588/17 with respect to technical LOS
should be met.
At the intermediate
level of maturity, the differences between current and expected technical
LOS are quantified into financial impacts and utilized within the lifecycle
management strategy (see Chapter 5).
At the advanced
level of maturity, municipalities take the additional step of considering
multiple LOS when quantifying financial impacts and consider the results within
the lifecycle management strategy (see Chapter 5).
Comparing Current LOS to Expected LOS (Technical)
As outlined earlier in this
chapter, a technical LOS analysis includes:
· An
identification of existing LOS;
· A
determination of expected (or desired) LOS; and
· An
assessment the implications of moving from existing LOS to expected (desired) LOS
over a forecast period.
Therefore, if
current LOS equates to what service level is currently provided, expected LOS
outlines the overall objective or target LOS to be reached at some point in
time. The amount of time it will take to reach expected LOS depends on the
assumptions a municipality makes within the asset management planning process.
Using different assumptions will lead to multiple scenarios and multiple
timelines within the within the lifecycle management strategy. For example, a
municipality could decide to meet expected LOS in a particular area in 10
years. When that scenario is assessed within the Lifecycle Management Strategy
(see Chapter 5) and the Financing Strategy (see Chapter 6) and concluded to be
too expensive too quickly, the LOS analysis can be updated to include another
scenario to reach expected LOS in 15 or 20 years. Alternate scenarios can also
represent different (e.g. higher or lower) levels of service.
Figure 4‑7
Technical LOS Analysis

This section deals specifically with the
comparison of current and expected LOS from a technical perspective as well as
the associated financial implications. While the financial implications are
used in other sections of the asset management plan, identifying gaps in
service levels is critical in assessing these implications. The table below
illustrates a high-level comparison of expected LOS (developed in earlier
sections) to current LOS. With this comparison in place, an action plan can be
established that outlines what has to be done in order to move towards expected
LOS. As mentioned earlier, the amount of time it takes to implement the action
plan and the expected level of service is a factor in assessing the overall
financial implications of the LOS analysis, therefore both the amount of time
and the level of service can be adjusted through the use of multiple LOS
scenarios.
Table 4‑9
Sample Current Technical LOS and Action Plans
|
Strategic
LOS Expected
(Customer
Perspective)
|
Technical
LOS Expected
(Staff
Perspective)
|
Current
LOS
|
Action
Plans
|
|
Safe, reliable roads with
adequate capacity
|
Average condition rating: Local (5/10), Collector (6/10), Arterial
(7/10)
|
Local: 4/10
Collector: 4/10
Arterial: 5/10
|
Increase funding to road rehabilitation and
replacement programs
|
|
Follow Minimum Maintenance Standards
|
Following MMS
|
N/A
|
|
Safe, reliable
bridges with adequate capacity
|
Average condition rating: 7/10
|
Current: 6/10
|
Increase
bridge rehabilitation program
|
|
Follow Minimum Maintenance Standards
|
Following MMS
|
N/A
|
|
Safe
sidewalks, access from subdivisions to downtown
|
Average condition: 7/10
|
Current: 6/10
|
Increase
sidewalk program
|
|
Minimize complaints
|
Current: 5
complaints
|
N/A
|
|
Reliable streetlights
|
Minimize complaints
|
Current: 8
complaints
|
N/A
|
|
Reliable traffic lights
|
Minimize complaints
|
Current: 3
complaints
|
N/A
|
|
Reliable and convenient transit services
|
Inspect and perform maintenance on
vehicles monthly
|
Inspection
and maintenance plan followed
|
Increase maintenance
funding
|
|
Minimize complaints
|
Current: 14
complaints
|
N/A
|
|
Convenient and secure parking locations
|
Minimize complaints
|
Current: 3
complaints
|
N/A
|
|
Safe
roads in winter
|
Follow MMS
|
Compliant
with MMS
|
N/A
|
|
Quality and efficient water supply, with adequate capacity
|
Meet
legislative requirements
|
Meeting legislative requirements
|
N/A
|
|
Unaccounted
for water under 30%
|
Unaccounted for water: 35%
|
Implement watermain looping program
|
|
Less than 5 main breaks annually, per
100 customers
|
Breaks per
100 customers: 2
|
N/A
|
|
Quality
wastewater collection, with adequate capacity and no environmental impacts
|
Meet legislative requirements
|
Meeting
legislative requirements
|
N/A
|
|
Minimize incidents of bypass
|
Incidents of
bypass: 0
|
N/A
|
|
Less than 5 main breaks annually, per
100 customers
|
Breaks per
100 customers: 20
|
Implement
CCTV inspection program
|
|
Stormwater system with adequate capacity
|
Minimize flooding incidents per 1,000
people
|
Flooding
Incidents: 0
|
N/A
|
|
Responsive and efficient solid waste collection system
|
Minimize complaints
|
Current: 32
complaints
|
Review routes
to reduce complaints
|
|
Inspect and perform maintenance on
vehicles monthly
|
Inspection
and maintenance plan followed
|
N/A
|
|
Responsive and quality fire services
|
Minimize response times
|
Response
times within requirements
|
N/A
|
|
Meet legislative requirements
|
Meeting
legislative requirements
|
N/A
|
|
Follow vehicle and equipment
replacement program
|
Maintenance
and replacement plan followed but underfunded
|
Increase
funding to equipment replacement
|
|
Responsive and quality police services
|
Minimize
response times
|
Response times within requirements
|
N/A
|
|
Meet
legislative requirements
|
Meeting legislative requirements
|
N/A
|
|
Follow vehicle and equipment
replacement program
|
Maintenance
and replacement plan followed but underfunded
|
Increase
funding to equipment replacement
|
|
Responsive and quality inspection services
|
Follow vehicle and equipment
replacement program
|
Maintenance
and replacement plan followed
|
N/A
|
|
Adequate quantity and quality
of recreation facilities
|
Utilization percentages for all
facilities to be between 80% and 100%
|
Ice Pad:
99% utilized, demand for more capacity
|
Expand to 2
ice pads
|
|
Reliable,
safe community halls
|
Follow facility maintenance program
|
Inspection and maintenance plan followed
|
N/A
|
|
Minimize complaints
|
Current: 5 complaints
|
N/A
|
|
Adequate quantity and quality
of parks
|
Provide 1 park per 1,000 residents
|
Currently 0.8
parks per 1,000 residents
|
1 new active
park
|
|
Safe and functional facilities
|
100% of
facilities to pass accessibility standards
|
40% of facilities pass accessibility standards
|
Accelerate accessibility compliance rehab program
|
|
Available, quality health care
|
Meet legislative requirements
|
Meeting
legislative requirements
|
N/A
|
|
Follow facility maintenance program
|
Inspection
and maintenance plan followed but underfunded
|
Increase
funding to facility maintenance
|
|
Reliable, responsive ambulance service
|
Minimize response times
|
Response
times within requirements
|
N/A
|
|
Meet legislative requirements
|
Meeting
legislative requirements
|
N/A
|
|
Follow vehicle and equipment
replacement program
|
Inspection
and maintenance plan followed
|
N/A
|
|
Available, well-maintained cemeteries
|
Minimize complaints
|
Current: 10
complaints
|
Increase
frequency of grass cutting
|
|
Available, functional housing for senior citizens
|
Meet legislative requirements
|
Meeting
legislative requirements
|
N/A
|
|
Follow facility maintenance program
|
Inspection
and maintenance plan followed
|
N/A
|
|
Available, safe child care service locations
|
Meet legislative requirements
|
Meeting
legislative requirements
|
N/A
|
|
Follow facility maintenance program
|
Inspection
and maintenance plan followed
|
N/A
|
|
Available, functional assisted living facilities
|
Meet legislative requirements
|
New
legislative requirements related to fire safety not being met in all
facilities
|
Immediately
replace components creating non-compliance
|
|
Follow facility maintenance program
|
Inspection
and maintenance plan followed
|
N/A
|
|
Available serviced land for development
|
Minimize complaints
|
Current: 1
complaint
|
N/A
|
|
Safe
and functional equipment and facilities
|
Minimize complaints
|
Current: 2
complaints
|
N/A
|
In the table above, action plan items can be detailed out
further in terms of timing and costing. For example:
Table 4‑10
Sample Technical Action Plan Scenarios
|
Action Item
|
Scenario 1
|
Scenario 2
|
Scenario 3
|
|
CCTV
Inspection Program
|
All wastewater mains inspected in 2 years:
$250,000
per year
|
All wastewater mains inspected in 5 years:
$100,000
per year
|
All wastewater mains inspected in 10 years:
$50,000
per year
|
These scenarios can be helpful in
educating Council and the public on the relationship between levels of service,
and costs to provide expected LOS. In the table above, the risks associated
with delaying the CCTV inspection program can also be discussed.
Action items can include:
· Non-infrastructure
items;
· Maintenance
items;
· Rehabilitation
items/programs;
· Replacement
items/programs; and/or
· Expansion
items/programs.
Costing Levels of Service Action Plans
The following steps are
required to cost levels of service action plans:
· Well-defined
levels of service scenarios and respective action plan items;
· A
clearly defined action plan, including what is needed, where it is needed, and
why;
· A
process of determining costs and unit rates associated with that action plan;
and
· Accurate
cost information.
When including action items
within the LOS analysis, municipalities should be mindful of:
· The
total cost of implementing the action plan;
· The
impact the action plan has on the future lifecycle costs of the applicable
assets (more on this in Chapter 5); and
· The
impact of the action plan items on projected LOS over the forecast period.
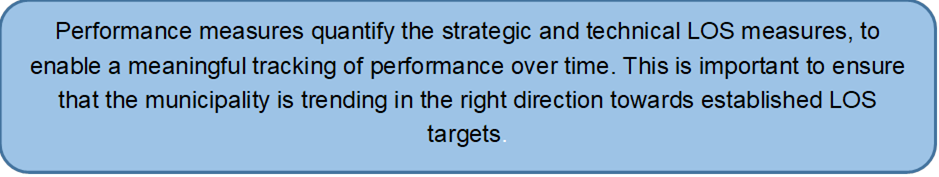
To what extent is the LOS analysis incorporating performance
measures?
Background
The technical LOS
described in earlier sections are often quantified through the use of
performance measures. Strategic (customer) LOS can also be quantified using
performance measures. Performance measures allow municipalities to track levels
of service over a number of years, which can provide a better understanding of
how successful their lifecycle management strategies (e.g. long-term forecasts)
have been in the past. With the correct tools, performance measures can also be
used to project future levels of service. This information can inform better
decision making for future long-term plans.
Levels of Maturity – LOS Performance Measures
To what extent
is the LOS analysis incorporating performance measures?
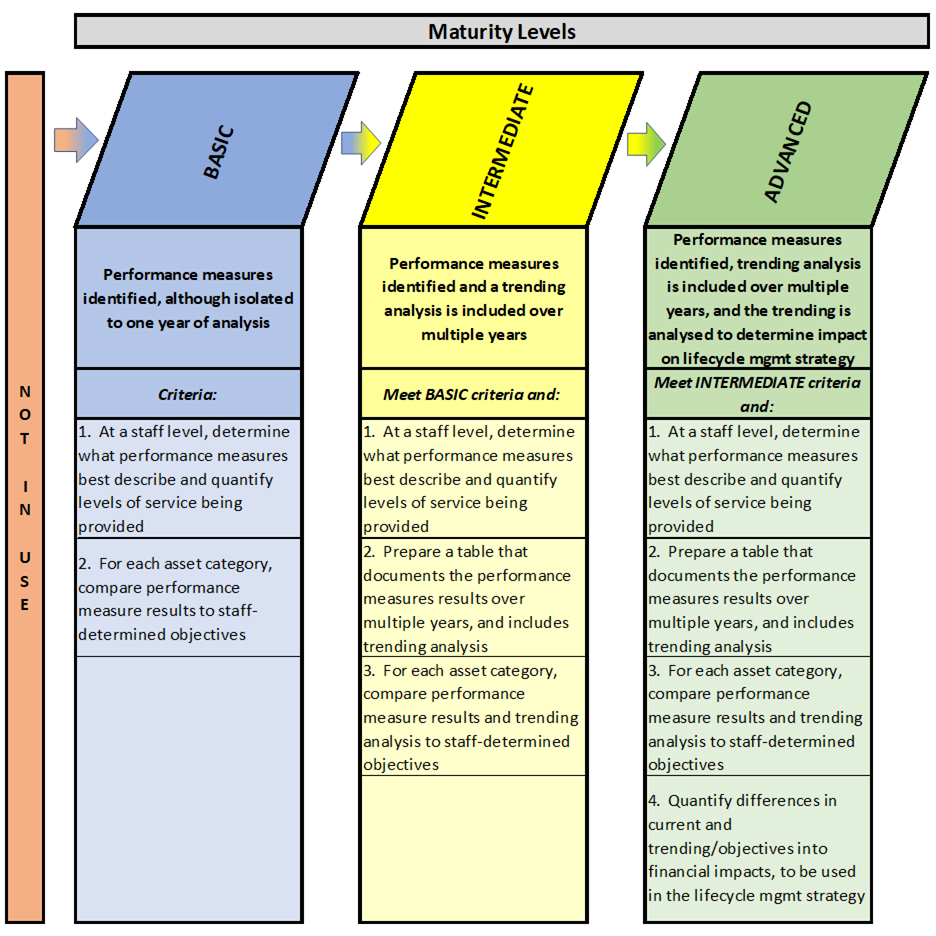
At the basic
level of maturity, staff typically identify and calculate performance measures
they deemed to be appropriate. At a minimum, performance measures outlined in
O.Reg 588/17 are used. For each asset category, the results of the performance
measures are compared to staff-determined objectives. The scope of analysis is
usually focused on one year.
At the intermediate
level of maturity, similar analyses are undertaken, and would also
highlight trends in performance measures over multiple years. This can be
accomplished through the use of a table that outlines performance measures over
multiple years. For each asset category, performance measure results and
trending analysis can be compared to staff-determined objectives.
At the advanced
level of maturity, after completing the steps outlined above in the
intermediate level, the differences between current performance measure results
and performance measure objectives are quantified into financial impacts and should
be used within the lifecycle management strategy (see Chapter 5).
Performance Measures
Previous sections of this
chapter explored elements of defining levels of service from a qualitative
point of view and assessing the associated financial implications. Performance
measures or key performance indicators (KPIs) are another method of documenting
and assessing levels of service. Performance measures provide a quantitative
basis for analysis which enables trend analysis to determine if a municipality
is moving towards or away from specified LOS objectives. For example, the use
of condition ratings from a performance measure perspective allows
municipalities to see what condition their assets are in now and also whether
that condition rating is getting better or worse over time.
Performance measures are
developed to assess the overall performance of assets, service delivery and/or
business efficiency. These measures can assist in identifying action items
(e.g. capital investment decisions, resource allocations, etc.) needed to move
towards expected service level objectives. Technical LOS measures are needed
for justification of operational decisions and to support capital investment
decisions, while strategic (customer) measures are required to assess asset
performance in terms of services provided to the customer. In both cases, performance
measures used by a municipality should be meaningful, transparent, constant/consistent
and easily measurable.
Performance measures can be
used to support both the strategic and technical LOS developed for each service
area. Having that direct link between the qualitative LOS measure and the
quantitative performance measure provides strength and verification to the LOS
analysis. This way it’s possible to identify where a level of service isn’t being
met and any trends that arise over time. For example, the strategic (customer)
LOS “road assets will be accessible 24 hours a day, 7 days a week” can be
supported by a performance measure that tracks the “number of road or bridge
closures due to poor asset condition”. In this example, if the number of
road/bridge closures due to poor asset condition are increasing year over year,
it indicates that the municipality is moving further away from its expected LOS
objective. Essentially, a performance measure provides an indication of how
well the level of service is being delivered. Below is a table expanding the
technical LOS discussions in earlier section to include potential performance
measures to track over time.
Table 4‑11
Sample Performance Measures
|
Strategic
LOS Expected
(Customer
Perspective)
|
Technical
LOS Expected
(Staff
Perspective)
|
Current
LOS
|
Performance
Measure
|
|
Safe, reliable roads with
adequate capacity
|
Average condition rating: Local (5/10), Collector (6/10), Arterial
(7/10)
|
Local: 4/10
Collector: 4/10
Arterial: 5/10
|
Average condition rating
|
|
Follow Minimum Maintenance Standards
|
Following MMS
|
Number of MMS non-compliance events
|
|
Safe, reliable
bridges with adequate capacity
|
Average condition rating: 7/10
|
Current: 6/10
|
Average
condition rating
|
|
Follow Minimum Maintenance Standards
|
Following MMS
|
Number of MMS
non-compliance events
|
|
Safe
sidewalks, access from subdivisions to downtown
|
Average condition: 7/10
|
Current: 6/10
|
Average
condition rating
|
|
Minimize complaints
|
Current: 5 complaints
|
Number of
complaints
|
|
Reliable streetlights
|
Minimize complaints
|
Current: 8 complaints
|
Number of
complaints
|
|
Reliable traffic lights
|
Minimize complaints
|
Current: 3 complaints
|
Number of
complaints
|
|
Reliable and convenient transit services
|
Inspect and perform maintenance on
vehicles monthly
|
Inspection and maintenance plan
followed
|
Number of
Out-of-Service days
|
|
Minimize complaints
|
Current: 14 complaints
|
Number of
complaints
|
|
Convenient and secure parking locations
|
Minimize complaints
|
Current: 3 complaints
|
Number of
complaints
|
|
Safe
roads in winter
|
Follow MMS
|
Compliant
|
MMS
Statistics
|
|
Quality and efficient water supply, with adequate capacity
|
Meet
legislative requirements
|
Meeting
legislative requirements
|
Number of days of Boil Water Advisory
|
|
Unaccounted
for water under 30%
|
Unaccounted
for water: 35%
|
% unaccounted for water
|
|
Less than 5 main breaks annually, per
100 customers
|
Breaks per 100 customers: 2
|
Main breaks
per 100 customers
|
|
Quality
wastewater collection, with adequate capacity and no environmental impacts
|
Meet legislative requirements
|
Meeting legislative requirements
|
N/A
|
|
Minimize incidents of bypass
|
Incidents of bypass: 0
|
Number of
incidents of bypass
|
|
Less than 5 main breaks annually, per
100 customers
|
Breaks per 100 customers: 20
|
Main breaks
per 100 customers
|
|
Stormwater system with adequate capacity
|
Minimize flooding incidents per 1,000
people
|
Flooding Incidents: 0
|
Number of
flooding incidents per 1,000 residents
|
|
Responsive and efficient solid waste collection system
|
Minimize complaints
|
Current: 32 complaints
|
Number of
complaints
|
|
Inspect and perform maintenance on
vehicles monthly
|
Inspection and maintenance plan
followed
|
Number of
Out-of-Service days
|
|
Responsive and quality fire services
|
Minimize response times
|
Response times within requirements
|
Response
times
|
|
Meet legislative requirements
|
Meeting legislative requirements
|
N/A
|
|
Follow vehicle and equipment
replacement program
|
Maintenance and replacement plan followed
but underfunded
|
Number of
Out-of-Service days
|
|
Responsive and quality police services
|
Minimize
response times
|
Response
times within requirements
|
Response times
|
|
Meet
legislative requirements
|
Meeting
legislative requirements
|
N/A
|
|
Follow vehicle and equipment
replacement program
|
Maintenance and replacement plan
followed but underfunded
|
Number of
Out-of-Service days
|
|
Responsive and quality inspection services
|
Follow vehicle and equipment
replacement program
|
Maintenance and replacement plan
followed
|
Number of
Out-of-Service days
|
|
Adequate quantity and quality
of recreation facilities
|
Utilization percentages for all
facilities to be between 80% and 100%
|
Ice Pad: 99% utilized, demand for
more capacity
|
Facility
capacity utilized
|
|
Reliable,
safe community halls
|
Follow facility maintenance program
|
Inspection and maintenance plan followed
|
Number of days
amenities unavailable
|
|
Minimize complaints
|
Current: 5 complaints
|
Number of complaints
|
|
Adequate quantity and quality
of parks
|
Provide 1 park per 1,000 residents
|
Currently 0.8 parks per 1,000
residents
|
Parks per
1,000 residents
|
|
Safe and functional facilities
|
100% of
facilities to pass accessibility standards
|
40% of
facilities pass accessibility standards
|
Percentage of facilities meeting accessibility
standards
|
|
Available, quality health care
|
Meet legislative requirements
|
Meeting legislative requirements
|
N/A
|
|
Follow facility maintenance program
|
Inspection and maintenance plan
followed but underfunded
|
Number of
deficiencies identified
|
|
Reliable, responsive ambulance service
|
Minimize response times
|
Response times within requirements
|
Response
times
|
|
Meet legislative requirements
|
Meeting legislative requirements
|
N/A
|
|
Follow vehicle and equipment
replacement program
|
Inspection and maintenance plan
followed
|
Number of
Out-of-Service days
|
|
Available, well-maintained cemeteries
|
Minimize complaints
|
Current: 1 complaint
|
Number of
complaints
|
|
Available, functional housing for senior citizens
|
Meet legislative requirements
|
Meeting legislative requirements
|
N/A
|
|
Follow facility maintenance program
|
Inspection and maintenance plan
followed
|
Number of
deficiencies identified
|
|
Available, safe child care service locations
|
Meet legislative requirements
|
Meeting legislative requirements
|
N/A
|
|
Follow facility maintenance program
|
Inspection and maintenance plan
followed
|
Number of
deficiencies identified
|
|
Available, functional assisted living facilities
|
Meet legislative requirements
|
New legislative requirements related
to fire safety not being met in all facilities
|
Number of
deficiencies identified
|
|
Follow facility maintenance program
|
Inspection and maintenance plan
followed
|
Number of
deficiencies identified
|
|
Available serviced land for development
|
Minimize complaints
|
Current: 1 complaint
|
Number of
complaints
|
|
Safe
and functional equipment and facilities
|
Minimize complaints
|
Current: 2 complaints
|
Number of
complaints
|
In
each of the performance measure examples above, a municipality can use an
overall performance objective and trending analysis to measure its progress in
moving towards expected LOS.
The Importance of Trending
If a municipality states “we
have an average condition rating on our park structures of 7.5 and an objective
of 9.0, they can safely say they are currently not meeting expected LOS.
However, what this municipality doesn’t know is whether or not they are
“trending” towards or away from the 9.0 condition objective. The graph below
shows 3 different situations this municipality could be in:
Figure 4‑8
Example of LOS Trending Analysis – Weighted
Average Condition
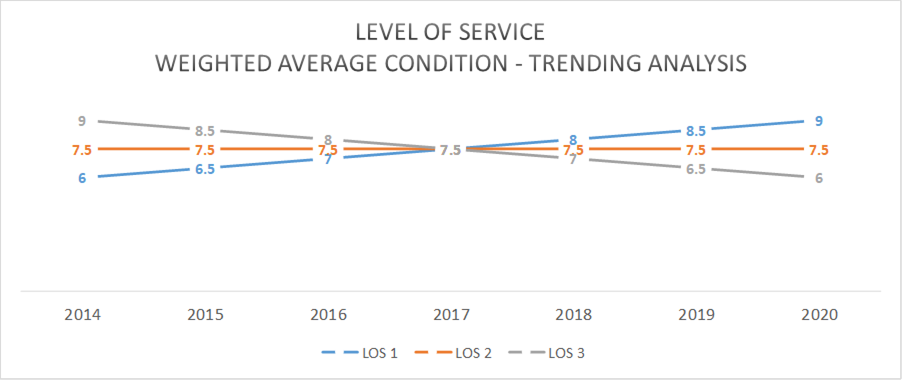
· LOS
1 (Blue): The municipality’s average condition rating is trending upwards;
· LOS
2 (Orange): The municipality’s average condition rating is remaining constant;
and
· LOS
3 (Gray): The municipality’s average condition rating is trending downwards.
The municipality will not
have enough information to know whether funding increases are needed for their
park structures if all they know is that the current average condition rating
is 7.5. Use of the trending analysis to complement this information assists in
making that decision.
This trending analysis can be
useful for any performance measure. The graph below illustrates the use of
trending for the purpose of tracking customer complaints. This type of graph may
be useful to project future potential complaints under a scenario whereby a
particular maintenance or rehabilitation program is not implemented.
Figure 4‑9
Example of LOS Trending Analysis – Customer
Complaints
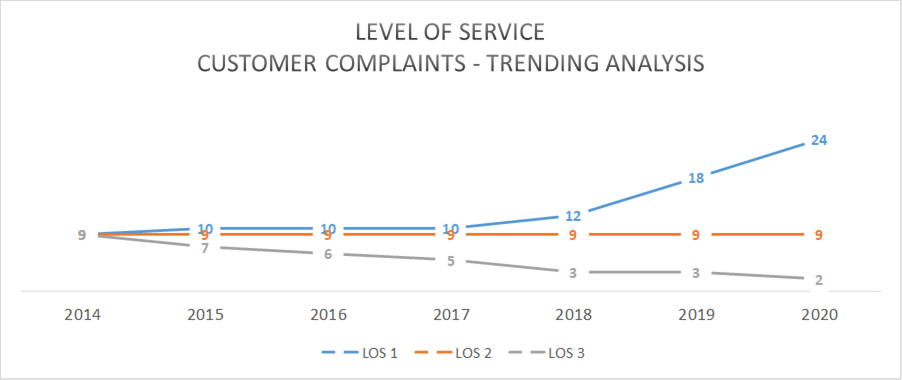
 Performance measures can be categorized into groups
(such as the attributes shown below).
Performance measures can be categorized into groups
(such as the attributes shown below).
· Quality;
· Reliability
/ Responsiveness;
· Customer
Service;
· Sustainability;
· Safety;
· Accessibility;
and
· Affordability
Some important things to keep
in mind when deciding on performance measures to incorporate into an asset
management process. Ensure they are:
· Repeatable;
· Consistent;
· Relevant
to the level of service and customer base;
· They
are within your control;
· Well
defined (how to calculate, what to include/exclude, etc.)
· That
consideration is given to industry standards; and
· The
time and cost associated with tracking and recording the measure is considered
against the value attained.
The ISO 55002 also highlights
the need for levels of service and performance measures to be SMART:
Figure 4‑10
ISO 55002 SMART Performance Measures
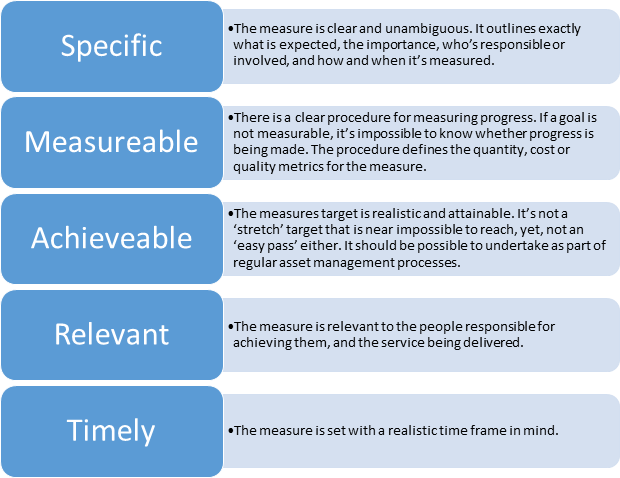
The following table provides some examples of performance
measures (related to both strategic and technical LOS):
Table 4‑12
Sample SMART Performance Measures
|
Service
|
Performance
Measure Examples
|
|
All Assets
|
· Average
condition assessment (by asset type or group)
· Percentage
of assets at or above a specified condition rating (by asset type or group)
· Return
on investment
· Operating
cost per asset (or by length of asset)
· Customer
complaints
· Response
times
· Availability
of service (or # service disruptions)
· Proportion
of unplanned vs. planned maintenance each year (e.g. facilities, roads,
bridges)
|
|
Roads
|
· Total
accidents per year, per 1,000 population, relating to road conditions
· Travel
time or intersection delays
· Percent
of signs found missing or ineffective during annual inspections
· Non-compliance
events (or %) with Minimum Maintenance Standards
|
|
Bridges and Culverts
|
· Operating
cost per m² of surface area
· Percent
of bridges with adequate load limits
· Non-compliance
events (or %) with Minimum Maintenance Standards
|
|
Facilities
|
· Proportion
of the population living within x km of a community centre or fire hall
· Percentage
of facilities that meet accessibility standards
· User
fees as a percentage of market rates
· User
fees as a percentage of full cost recovery rates
· Operating
and maintenance costs recovered from user charges
· Utilization
percentages of ice pads, pools, etc.
· Frequency
of cleaning and maintenance activities
· Number
of reported accidents per year
|
|
Solid Waste
|
· Percent
of properties that receive regular waste/recycling collection
· Average
volume of waste per household, per year
|
|
Stormwater
|
· Number
of blockages or flooding incidents per year (with # residents affected)
· Number
of times roads closed due to flooding per year (or length of closure time)
|
|
Water
|
· Watermain
breaks per km of pipe
· Number
of boil water advisories (with # residents affected)
· Planned
vs. unplanned shutdowns or disruptions
· Length
of time of shutdowns or disruptions
· %
unaccounted for water (water billed vs. water produced)
· Pressure
at connection
· Storage
capacity
· Water
consumption by customer type
· Percentage
of facility sites with backup power
· Number
of incidents not in compliance with legislation
|
|
Wastewater
|
· Incidents
of bypass
· Percentage
of wastewater bypassed treatment
· Number
of wastewater backups
· Infiltration
rate
· Wastewater
billed vs. wastewater treated
· Percentage
of facility sites with backup power
· Number
of incidents not in compliance with legislation
|
Prepared
drawing some examples from the IIMM Manual
The following is
an example of strategic (customer) levels of service performance
measures for a road network.
Table 4‑13
Sample Strategic LOS Performance Measures – Road Network
|
Key Performance Measure
|
Strategic Level of Service
|
Performance Measure Process
|
Performance Target
|
|
Quality
|
Well-maintained and suitable transport services
|
Customer complaints
|
< 30 complaints per annum for all transport asset categories
|
|
Customer Satisfaction
|
Condition of local roads
|
Customer Survey
|
Score >= 6 out of 10 in Annual Customer Survey
|
|
Customer Satisfaction
|
Condition of sidewalks
|
Customer Survey
|
Score >= 6 out of 10 in Annual Customer Survey
|
|
Accessibility
|
Road assets will be accessible 24 hours a day, 7 days a week
|
No. of road or bridge closures due to degraded asset condition
|
< 10 per annum
|
|
Function
|
Road line marking is well
maintained
|
Customer Survey
|
Score >= 6 out of 10 in Annual Customer Survey
|
|
Function
|
Bridges (pedestrian and vehicular) provide safe and equitable access to
all parts of the municipality to meet community needs
|
No. of complaints relating to
bridges
|
< 10 per annum
|
|
Responsiveness
|
Response time to customer requests
|
Time taken to close requests
|
> 80% of all requests adequately responded to within target
|
The following is an example of technical levels of service performance
measures for a road network.
Table 4‑14
Sample Technical LOS Performance Measures – Road Network
|
Key Performance
Measure
|
Strategic Level of Service
|
Performance
Measure Process
|
Performance Target
|
|
Condition: Sealed Roads
|
Condition assessment of road network every 5 years
|
Condition Assessment
|
On average Pavement Condition Index and Surface
Condition Index to be in condition 6 (out of 10) or better, with 10 being the
best
|
|
Condition: Sidewalks
|
Condition assessment of sidewalk network every 5 years
|
Condition Assessment
|
On average, footpath network to be in condition 7 (out
of 10) or better, with 10 being the best
|
|
Condition: Curbs
|
Condition assessment of curbs every 5 years
|
Condition Assessment
|
On average, curbs to be in condition 6 (out of 10) or
better, with 10 being the best
|
|
Condition:
Bridges
|
Bridge
Inspection every 2 years
|
Condition
Assessment
|
On average, bridge network to be in condition 6 (out
of 10) or better, with 10 being the best
|
Table 4‑15
LOS Metrics for Core Infrastructure Required Under O.Reg
588/17
Water Assets (Table 1)
|
Column 1
Service attribute
|
Column 2
Community levels of service (qualitative descriptions)
|
Column 3
Technical levels of service (technical metrics)
|
|
Scope
|
1. Description, which may include maps, of the user groups or
areas of the municipality that are connected to the municipal water system.
2. Description, which may include maps, of the user groups or areas of
the municipality that have fire flow.
|
1. Percentage of properties connected to the municipal water
system.
2. Percentage of properties where fire flow is available.
|
|
Reliability
|
Description of boil water advisories and service interruptions.
|
1. The number of connection-days per year where a boil water
advisory notice is in place compared to the total number of properties
connected to the municipal water system.
2. The number of connection-days per year due to water main
breaks compared to the total number of properties connected to the municipal
water system.
|
Wastewater Assets (Table 2)
|
Column 1
Service attribute
|
Column 2
Community levels of service (qualitative descriptions)
|
Column 3
Technical levels of service (technical metrics)
|
|
Scope
|
Description, which may include maps, of the user groups or areas of
the municipality that are connected to the municipal wastewater system.
|
Percentage of properties connected to the municipal wastewater
system.
|
|
Reliability
|
1. Description of how combined sewers in the municipal
wastewater system are designed with overflow structures in place which allow
overflow during storm events to prevent backups into homes.
2. Description of the frequency and volume of overflows in combined
sewers in the municipal wastewater system that occur in habitable areas
or beaches.
3. Description of how stormwater can get into sanitary sewers in the
municipal wastewater system, causing sewage to overflow into streets or
backup into homes.
4. Description of how sanitary sewers in the municipal wastewater
system are designed to be resilient to avoid events described in paragraph 3.
5. Description of the effluent that is discharged from sewage treatment
plants in the municipal wastewater system.
|
1. The number of events per year where combined sewer flow in
the municipal wastewater system exceeds system capacity compared to the total
number of properties connected to the municipal wastewater system.
2. The number of connection-days per year due to wastewater backups compared
to the total number of properties connected to the municipal wastewater
system.
3. The number of effluent violations per year due to wastewater
discharge compared to the total number of properties connected to the
municipal wastewater system.
|
Stormwater Management Assets (Table 3)
|
Column 1
Service attribute
|
Column 2
Community levels of service (qualitative descriptions)
|
Column 3
Technical levels of service (technical metrics)
|
|
Scope
|
Description, which may include maps, of the user groups or areas of
the municipality that are protected from flooding, including the extent of
the protection provided by the municipal stormwater management system.
|
1. Percentage of properties in municipality resilient to a
100-year storm.
2. Percentage of the municipal stormwater management system resilient
to a 5-year storm.
|
Roads Assets (Table 4)
|
Column 1
Service attribute
|
Column 2
Community levels of service (qualitative descriptions)
|
Column 3
Technical levels of service (technical metrics)
|
|
Scope
|
Description, which may include maps, of the road network in the
municipality and its level of connectivity.
|
Number of lane-kilometres of each of arterial roads, collector roads
and local roads as a proportion of square kilometres of land area of the
municipality.
|
|
Quality
|
Description or images that illustrate the different levels of road
class pavement condition.
|
1. For paved roads in the municipality, the average pavement
condition index value.
2. For unpaved roads in the municipality, the average surface condition
(e.g. excellent, good, fair or poor).
|
Bridges and Culverts Assets (Table 5)
|
Column 1
Service attribute
|
Column 2
Community levels of service (qualitative descriptions)
|
Column 3
Technical levels of service (technical metrics)
|
|
Scope
|
Description of the traffic that is supported by municipal bridges
(e.g., heavy transport vehicles, motor vehicles, emergency vehicles,
pedestrians, cyclists).
|
Percentage of bridges in the municipality with loading or dimensional
restrictions.
|
|
Quality
|
1. Description or images of the condition of bridges and how
this would affect use of the bridges.
2. Description or images of the condition of culverts and how this
would affect use of the culverts.
|
1. For bridges in the municipality, the average bridge
condition index value.
2. For structural culverts in the municipality, the average bridge
condition index value.
|
Documentation
With respect to performance
measures, it is important to have controls in place to ensure they are
calculated in an accurate and consistent manner from year to year. Given the
dynamic nature of municipalities (and asset management), it is recommended that
documentation be kept that includes:
1.
Which performance measures are to be calculated;
2.
Which performance measures are associated with which assets;
3.
How often they are to be calculated;
4.
How (specifically) they are to be calculated (all variables in the
calculation); and
5.
All assumptions made in the calculation of each performance measure.
To what extent is service capacity data used in the LOS
analysis with respect to benchmarking over multiple years?
Background
In the technical LOS section above, the
concept of service capacity was introduced and the importance of using this
data within the AM process was stressed. The ability to track this data over
time allows municipalities to trend anticipated service capacities in the
future, as well as assist in making more informed AM decisions.
Levels of Maturity
To what extent is service
capacity data used in the LOS analysis with respect to benchmarking over
multiple years?
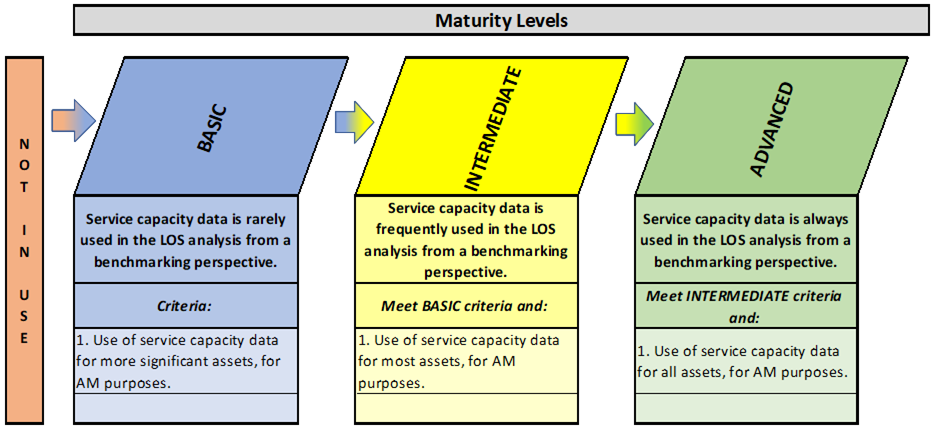
At the
basic level of maturity, municipalities use the service capacity data in
the LOS analysis for more significant assets and typically only for asset
management purposes.
At the
intermediate level of maturity, municipalities use the service capacity
data in the LOS analysis from a benchmarking perspective for many of the
assets.
At the advanced
level of maturity, municipalities use the service capacity data in the LOS
analysis for all its assets.
Benchmarking Service Capacity Data
The
concept of utilizing performance measures through trending was discussed in
previous sections above. This is just as applicable in the use of service
capacity data. Figure 4-9 graphically shows how trending data can assist in
making decisions within the AM planning process.
This graph could be useful in projecting out potential service capacity if a
particular maintenance or rehabilitation program is not implemented. For
example, if a municipality is considering an expansion to a water or wastewater
plant, understanding the capacity of those plants is imperative to determining
the timing and extent of the expansion.
4.11 Resources
and References
Institute of Public Works Engineering Australasia (IPWEA),
NAMS.PLUS Asset Management, https://www.ipwea.org/communities/assetmanagement/namsplus
IPWEA, 2014, Practice Note 8: Levels of Service &
Community Engagement, http://www.ipwea.org/publications/bookshop/ipweabookshop/practicenotes/pn8
IPWEA, 2015, International
Infrastructure Management Manual, https://www.ipwea.org/publications/bookshop/ipweabookshop/iimm
International
Organization for Standardization (ISO), 2014, ISO 55000:2014, Asset
management – Overview, principles and terminology, http://www.iso.org/iso/catalogue_detail?csnumber=55088