6.3 Consideration of All Funding Sources
6.7 Reserve/Reserve Fund Planning
6.9 Rate Impacts (Taxation, User Fees, etc.)
6.10 Integrated Funding Analysis
6.11 Identifying Funded Capital Priorities
6.3 Consideration of All Funding Sources
6.7 Reserve/Reserve Fund Planning
6.9 Rate Impacts (Taxation, User Fees, etc.)
6.10 Integrated Funding Analysis
6.11 Identifying Funded Capital Priorities
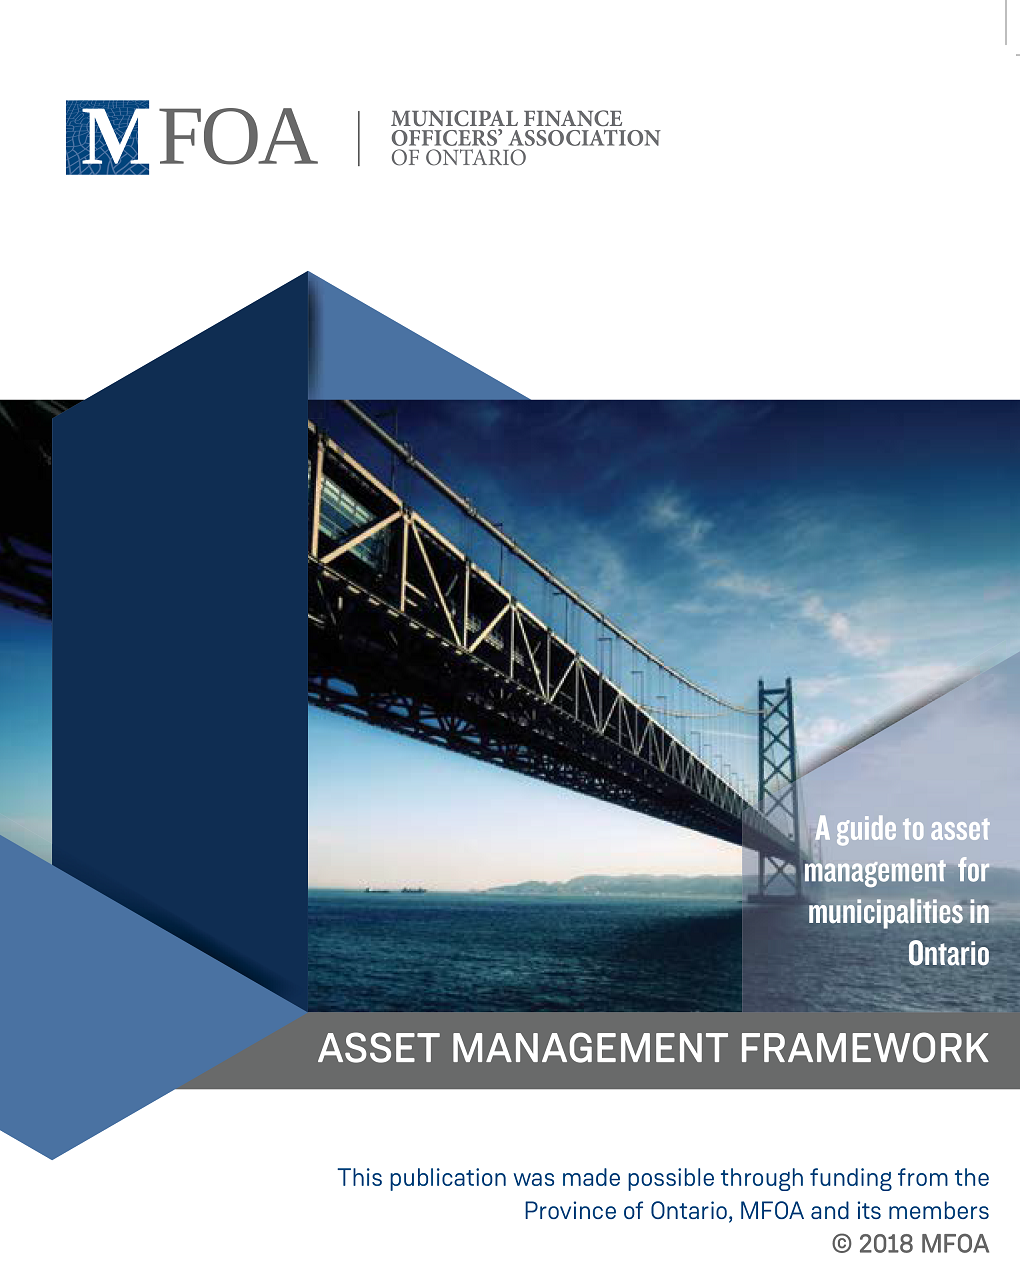
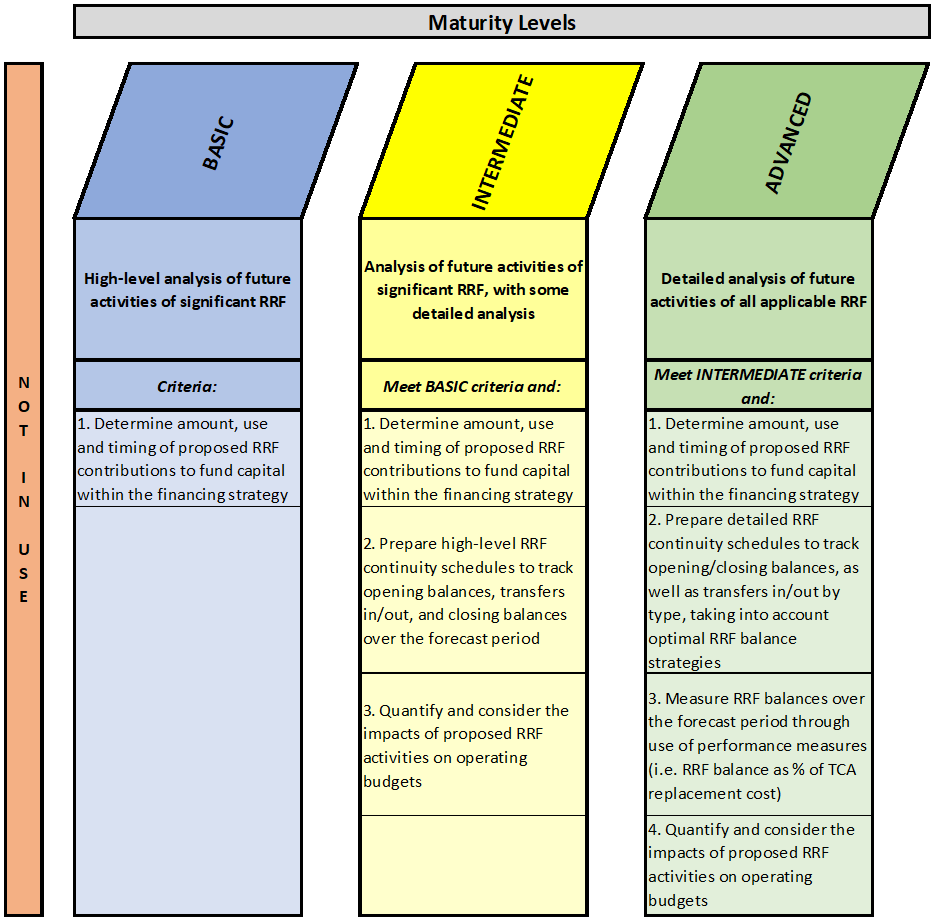
This framework is intended for municipalities of all sizes and maturity levels. The use of maturity diagrams within this framework will assist municipalities to identify their current levels of maturity for each AM area. Furthermore, for municipalities that have a desire to move to a higher level of maturity over time, the diagrams will provide potential approaches to doing so. To more easily depict the maturity levels ascribed to specific questions posed within the framework, the following diagram will be utilized for each question:
This document is intended to help municipalities make progress on their asset management planning. By enhancing the readers’ understanding of asset management maturity, they can more accurately determine their current, and work toward achieving the desired or appropriate, level of maturity for their municipality.
The asset management framework can be likened to a continuum, whereby municipalities should aim to implement the components described in a subsequent maturity level. For example, municipalities that are not practicing asset management should strive to meet components at the basic level, and likewise, municipalities that currently meet the basic or intermediate levels should strive to advance their practices to meet the components of the next level. However, it should be noted that during this self-assessment process a municipality may decide to skip over maturity levels (i.e. move from basic to advanced, skipping intermediate). This is perfectly acceptable. Further, not every municipality will need to strive for the highest level of maturity in every area. For example, it may not make sense for a small municipality to meet certain advanced level components.
Readers can use the following descriptions of the maturity levels to guide their assessment throughout the various sections of this framework:
Municipalities that are not undertaking the components described in a particular section of this framework should focus on meeting the basic level requirements outlined in the maturity level diagram.
At the basic level of maturity, a municipality is undertaking the components of asset management shown in blue and will take steps to advance their asset management by implementing the components described under the intermediate level heading.
At the intermediate level of maturity, a municipality is currently meeting the requirements shown in yellow and to advance their asset management will take steps to implement the components described under the advanced level heading.
At the advanced level of maturity, a municipality is currently meeting the requirements shown in green.
These maturity framework visuals are found throughout this document. Preceding all maturity level diagrams is a self-assessment question for the reader to consider to help determine where their municipality best fits within the framework.
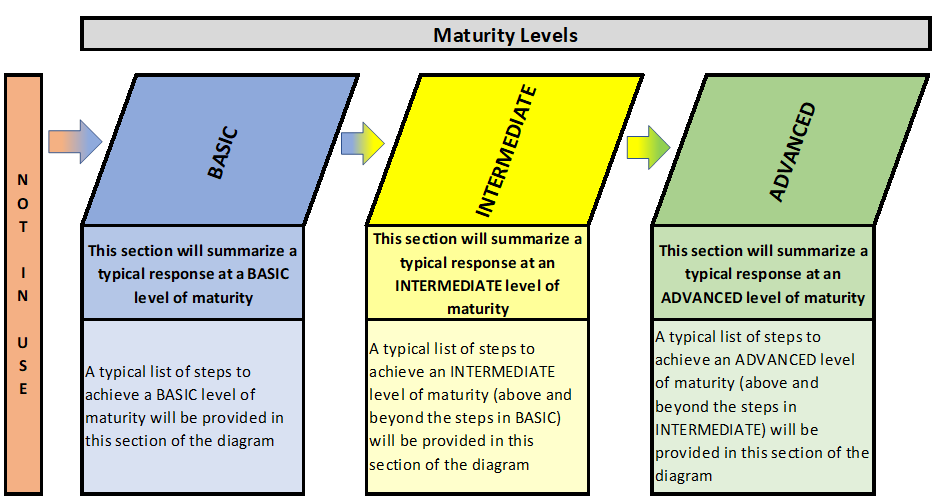
An asset management financing strategy outlines the suggested approach to funding the lifecycle management strategy (i.e. long-term forecast, see Chapter 5) that is proposed to be adopted by the municipality. The financing strategy forms an integral framework for ensuring the municipality makes optimal use of the various funding sources that it has at its disposal. It will provide a foundation for preparing other long-term financial plans including operating and capital budgets and forecasts, and financial policies, such as the use of debt and reserve/reserve funds. Further, it provides an opportunity for important analyses to be performed, including taxation and user fee rate impacts, other rate sensitivity analysis, and determination of both the infrastructure gap and funding gap.
Figure 6‑1
Financing Strategy Impacts
Key Assumptions
Key assumptions related specifically to the financing strategy should be carefully considered by municipalities. When creating a plan that spans 10, 20, or more years, the slightest change in one variable can drastically change the outcome. Some key variables to consider:
· Capital inflation rate;
· Operating inflation rate;
· Debt term and rate;
· Rate of return on investments (i.e. reserve funds); and
· Growth (i.e. assessment growth for taxation and customer growth for user fees).
To provide an example of the impact and importance of determining a reasonable and defensible value for each variable (in this case, capital inflation rate), consider the following. The replacement cost today of a $1 million asset would in 20 years be valued at:
· $1.49 million using 2% annual capital inflation;
· $1.81 million using 3% annual capital inflation; or
· $2.19 million using 4% annual capital inflation.
This demonstrates the importance of determining a reasonable and defensible value for each of the variables from the list above – in this example, capital inflation rate.
Changing one variable in the calculation results in a substantial difference in cost estimates. Multiply this one example by the thousands of capital assets a municipality may own and the impact of adjusted variables will be significant.
When creating a financing strategy for a long forecast period, consider not what those variables are today, but what they could be over the forecast period (e.g. 20 years). If anticipating the variables proves to be difficult, one approach entails looking at historical results for the same time period (e.g. the last 20 years). For example, to forecast capital inflation for the next 20 years, the results of construction price indexes can be analyzed for the last 20 years. The estimates of these variables should be updated periodically to reflect the most recent historical data available.
Infrastructure for Jobs and Prosperity (IJPA) Act and O. Reg 588/17 Requirements
O.Reg 588/17 outlines the following requirements with respect to the Financing Strategy:
Every municipality shall prepare an asset management plan in respect of its core municipal infrastructure assets by July 1, 2021, and in respect of all of its other municipal infrastructure assets by July 1, 2023.
A municipality’s AM plan must include the following with respect to a financing strategy by July 1, 2024:
a) A lifecycle management and financial strategy that sets out the following information with respect to the assets in each asset category for the 10-year period:
i. An identification of the lifecycle activities that would need to be undertaken to provide the proposed levels of service described in paragraph 1, based on an assessment of the following:
A. The full lifecycle of the assets.
B. The options for which lifecycle activities could potentially be undertaken to achieve the proposed levels of service.
C. The risks associated with the options referred to in sub-subparagraph B.
D. The lifecycle activities referred to in sub-subparagraph B that can be undertaken for the lowest cost to achieve the proposed levels of service.
ii. An estimate of the annual costs for each of the 10 years of undertaking the lifecycle activities identified in subparagraph i, separated into capital expenditures and significant operating costs.
iii. An identification of the annual funding projected to be available to undertake lifecycle activities and an explanation of the options examined by the municipality to maximize the funding projected to be available.
iv. If, based on the funding projected to be available, the municipality identifies a funding shortfall for the lifecycle activities identified in subparagraph i,
A. an identification of the lifecycle activities, whether set out in subparagraph i or otherwise, that the municipality will undertake, and
B. if applicable, an explanation of how the municipality will manage the risks associated with not undertaking any of the lifecycle activities identified in subparagraph i.
b) For municipalities with a population of less than 25,000, as reported by Statistics Canada in the most recent official census, a discussion of how the assumptions regarding future changes in population and economic activity informed the preparation of the lifecycle management and financial strategy.
c) For municipalities with a population of 25,000 or more, as reported by Statistics Canada in the most recent official census,
i. the estimated capital expenditures and significant operating costs to achieve the proposed levels of service as described in paragraph 1 in order to accommodate projected increases in demand caused by population and employment growth, as set out in the forecasts or assumptions referred to in paragraph 6 of subsection 5 (2), including estimated capital expenditures and significant operating costs related to new construction or to upgrading of existing municipal infrastructure assets,
ii. the funding projected to be available, by source, as a result of increased population and economic activity, and
iii. an overview of the risks associated with implementation of the asset management plan and any actions that would be proposed in response to those risks.
Does the municipality have a financing strategy that considers all applicable funding sources?
Background
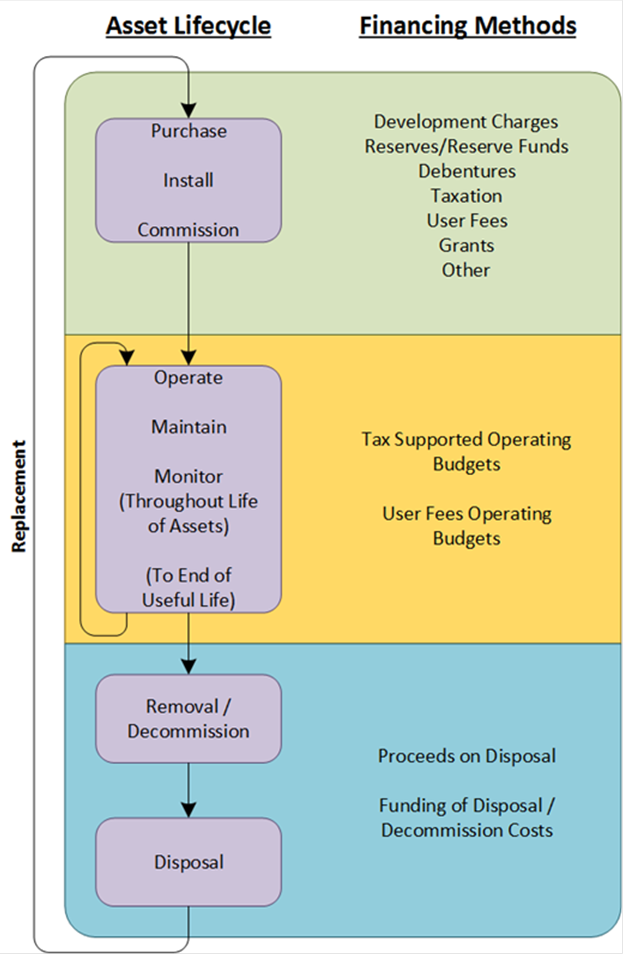
When considering various funding alternatives within the financing strategy, it is important for a municipality to consider all available revenue and financing tools, including taxation, reserves, reserve funds, debt, user fees, grants, etc. Figure 6‑2 (below) illustrates how various financing methods can be used for both initial asset purchases as well as asset replacements over a lifecycle period. The initial capital purchase or construction cost is generally a larger investment of funds, requiring consideration of funding from various sources as available. Ongoing costs to operate, maintain, and monitor capital assets are generally funded through the operating budget (taxation or user fee) annually. Costs to repair are typically capital in nature, and disposal/decommissioning costs need to be taken into account when ultimately replacing the asset.
Figure 6‑2
Sample Asset Lifecycle and Associated Financing Methods
Levels of Maturity – Consideration of Funding Sources
Does the municipality have a financing strategy that considers all applicable funding sources?
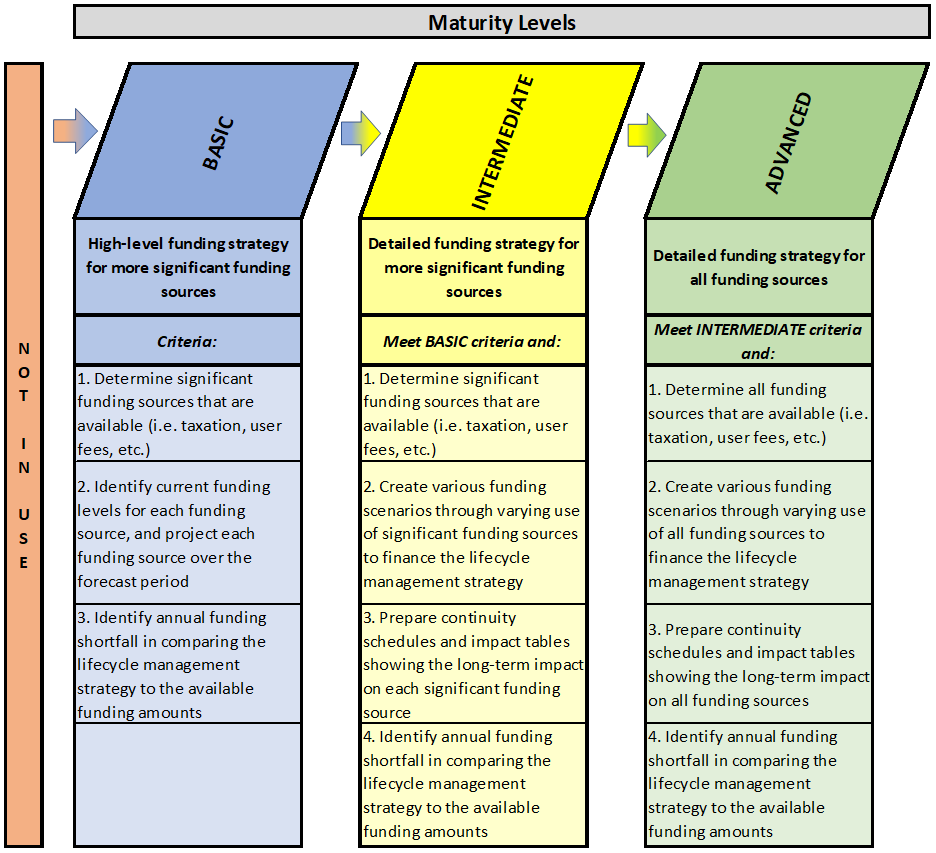
At the basic level of maturity, municipalities typically follow a high-level funding strategy for only the more significant funding sources. The focus would first be on determining the significant funding sources related to capital requirements, such as taxation, user fees, grants, etc. The current funding levels of each funding source would be identified and projected increases shown over the forecast period. At this point, by comparing the cost of necessary capital works from the lifecycle management strategy against the available funding dollars, the municipality will have identified its annual funding shortfall or “funding gap”.
At the intermediate level of maturity, municipalities undertake a detailed funding strategy but only for more significant funding sources. The focus would first be on determining the significant funding sources related to capital requirements, such as taxation, user fees, grants, etc. Various funding scenarios would be created to assess long-term impacts of using varying levels of funding from different significant funding sources. This would generally be accomplished through the use of continuity schedules and impact tables created for each significant funding source. At this point, by comparing the cost of necessary capital works from the lifecycle management strategy against the available funding dollars, the municipality will have identified its annual funding shortfall or “funding gap”.
At the advanced level of maturity, municipalities undertake a detailed funding strategy for all funding sources. The focus would first be on determining all funding sources related to capital requirements. Various funding scenarios would be created to assess long-term impacts of using varying levels of funding from different funding sources. This would generally be accomplished through the use of continuity schedules and impact tables created for each funding source. At this point, by comparing the cost of necessary capital works from the lifecycle management strategy against the available funding dollars, the municipality will have identified its annual funding shortfall or “funding gap”.
Available Funding Sources
The funding strategies for the municipality’s capital investment should be considered in order to determine the most appropriate and sustainable options. Two common approaches are:
· Pay as you go; and
· Funding from capital reserves/reserve funds.
Pay as you go
“Pay as you go” funding methods are capital costs being funded by taxation and/or user fees at the time that the capital acquisitions are made, in addition to the issuance of debt for the remaining unfunded amounts. The debt payments (principal and interest) will then form part of future operating budget expenditures. Pay as you go is typically a more suitable strategy for shorter life and/or lower value assets. Using this approach on higher value assets could lead to the over utilization of debt financing, based on a municipality’s available debt capacity.
Funding from Capital Reserves/Reserve Funds
Another funding strategy can be established whereby an annual transfer from the applicable operating budgets to capital reserves or reserve funds is undertaken, to build a source of funds for future capital works. The creation of capital reserve funds (as opposed to reserves) provides the opportunity to earn interest, and therefore, compounds the benefits of contributions made.
Summary
A municipality will have to decide whether to base their financing strategy on the “pay as you go” methodology, “reserve/reserve fund” methodology, or a combination of the two.
In addition to debt and reserve/reserve funds, a municipality should consider other funding sources, such as taxation, user fees, grants, third party contributions, development charges, municipal act charges, donations, and any other appropriate sources. As will be illustrated in future sections to this chapter, each funding source can be analyzed using continuity schedules and other methodology to determine the optimal use within the asset management plan financing strategy.
Financing Policies
To provide the necessary guidance and support in further developing funding strategies, it is recommended that financial policies be developed, implemented, and utilized both in the asset management process and budget process. Financial policies are uniquely crafted and aimed at detailing the principles that a municipality will follow in order to reach their funding strategy goals and objectives. Most importantly, funding strategy policies will detail all requirements that must be met throughout the financing strategy development process, whether related to legislated requirements, organizational mandates, or best practices.
For examples of relevant policies, consider the following:
· Self-sustaining funds;
· Reserves & reserve funds;
· Use of debt financing; and
· Allocation of annual surplus.
Self-Sustaining Funds
Municipalities’ budgets generally consist of services supported by taxation, and services supported by user fees, such as water services, wastewater services, parking services, etc. In some municipalities, these service areas may be combined with “cross-subsidization” occurring between the areas (i.e. taxation funding a portion of water costs). Best practices involve treating services supported by taxation, water user fees, and wastewater user fees as three distinct and self-sustaining budgets. Any other self-sustaining service should be treated in a similar manner.
Reserves and Reserve Funds
Municipalities use various reserves and reserve funds for both capital and operating needs. Developing reserve and reserve fund policies can assist in managing the amount of contributions to be budgeted annually and thus facilitate predictable and consistent budget impacts. Also, optimal reserve/reserve fund balances can be discussed within the policy. The use of reserve funds allows for the accrual of interest earned on reserve fund balances on an annual basis. Thus, reserve fund balances will grow with their share of interest earned.
Use of Debt Financing
Debt can be used as an effective source of capital funding when significant capital projects are required that exceed other available sources of financing. The use of debt enables the impact of capital financing to be spread over a longer period of time, resulting in future residents sharing in the cost of capital projects. The Province establishes a debt annual repayment limit (ARL) of 25% of municipal revenues.[1] Municipalities can implement an internal debt policy which further restricts debt costs annually, if deemed necessary.
Allocation of Annual Surplus[2]
At the end of each year, municipalities are in a position to determine whether actual annual revenues and expenses either exceed or fall short of annual budgeted amounts. This analysis determines the annual surplus or deficit for the year. Municipalities can have multiple annual surplus/deficits based on the various self-sustaining funds they manage. Some municipalities will use annual surpluses as a funding source in the subsequent year. This approach can result in fluctuating impacts on the operating budget each year that can make balancing the budget difficult. Alternatively, year-end surpluses can be transferred to the appropriate reserves and reserve funds, for future use. While a portion of these funds can be directed to operating-related reserves/reserve funds (such as rate stabilization funds and working capital reserves), funds can also be used for capital-related initiatives, such as funding the asset management plan. In the event that a deficit is calculated, the deficit could be funded by the appropriate reserves or reserve funds.
What method is used to incorporate expansion needs (i.e. growth and/or new service areas) into the financing strategy?
Background
Municipalities may need to expand their asset holdings for a number of reasons. Council may decide that they wish to add new service areas (e.g. skateboard parks, theatres, etc.), or enhance current services (e.g. upgrade gravel roads to paved roads, enhanced transit services, etc.) for existing taxpayers and citizens. Additionally, more assets may be required as a result of growth in the community.
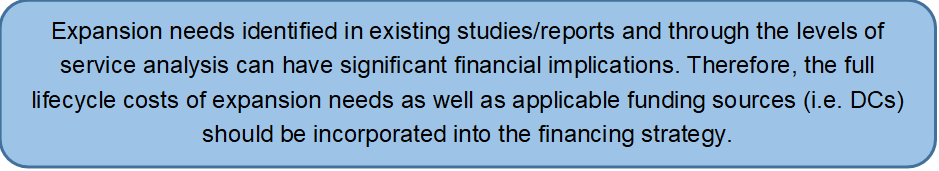
In each case, municipalities should incorporate expansion needs and expansion-related funding sources into the financing strategy. In addition, expansion of assets translates into additional lifecycle costs of which a municipality must be aware (e.g. costs to operate, maintain, and eventually rehabilitate/replace these assets). The impacts of expansion needs are usually significant, and as such, should be managed in a prudent manner.
Levels of Maturity – Expansion Needs
What method is used to incorporate expansion needs (i.e. growth and/or new service areas) into the financing strategy?
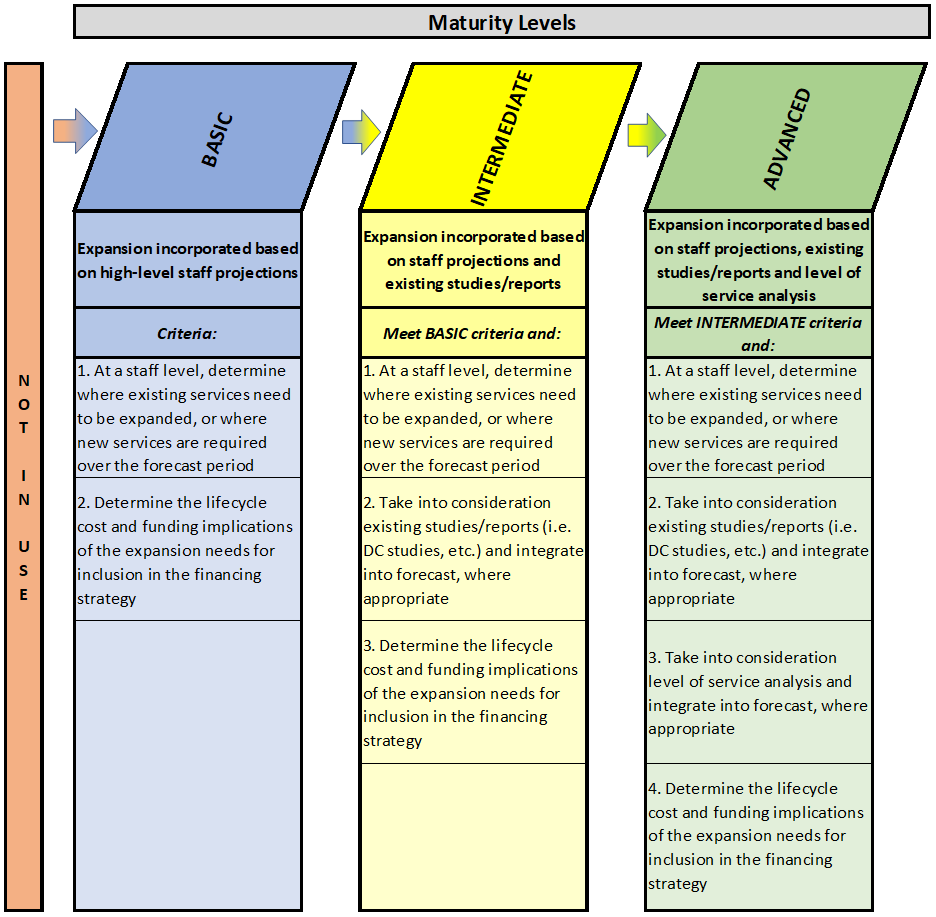
At the basic level of maturity, municipalities incorporate expansion needs into the financing strategy based on high-level staff projections. Staff will determine, for the forecast period, where either existing services need to be expanded or where new services will be required. Staff will then project the lifecycle cost and funding implications of these expansion needs for inclusion in the financing strategy. At a minimum, the growth requirements outlined in O.Reg 588/17 will be followed.
At the intermediate level of maturity, expansion needs will be incorporated into the financing strategy based on both staff projections and existing studies/reports. Staff will determine, for the forecast period, where either existing services need to be expanded or where new services will be required. Further consideration will be given to existing studies and/or reports (e.g. DC studies, planning reports, etc.), and incorporated into the capital forecast, where appropriate. Staff will then project the lifecycle cost and funding implications of these expansion needs for inclusion in the financing strategy.
At the advanced level of maturity, expansion needs will be incorporated into the financing strategy based on staff projections, existing studies/reports, and levels of service analysis. Staff will determine, for the forecast period, where either existing services need to be expanded or where new services will be required. Further consideration will be given to existing studies and/or reports (e.g. DC studies, planning reports, etc.), and incorporated into the capital forecast, where appropriate. As an additional step, consideration will also be given to any levels of service analysis undertaken, with related impacts also added into the capital forecast. Staff will then project the lifecycle cost and funding implications of these expansion needs for inclusion in the financing strategy.
Expansion Needs
In the absence of reports or studies (e.g. master plans, DC studies, etc.) that outline expansion needs of a municipality, staff will have to determine potential impacts of expansion needs at a high-level for inclusion into the asset management process. While the initial assessment of expansion needs takes place both in the levels of service analysis (Chapter 4) and the lifecycle management strategy (Chapter 5), the financing strategy must consolidate and list these expansion needs, and also project the funding implications. For example, if a municipality wishes to construct a skateboard park (and has never provided that service in the past), it could be viewed as an asset expansion. From a financing strategy perspective, the following questions should be considered:
· How is the initial construction of the skateboard park going to be funded? Are there DC funds available for use?
· What are the ongoing operating and maintenance costs identified in the lifecycle management strategy, and how will they be funded?
· At what point is rehabilitation or replacement needed? What is the impact on budgets between now and then, given a municipality’s funding strategies?
Development Charges
In cases where growth is a driver for additional capital needs, many municipalities will implement development charge (DC) background studies (and DC by-laws) to help finance growth-related capital costs. This allows the municipality to collect DCs on growth that occurs and use those DCs to fund projects that are either fully or partially driven by growth. The DC background study typically lists not only the capital projects anticipated to be related to growth, but also a projection of the anticipated growth over a defined period.
A municipality can use the information contained within their DC background study to project the impacts of growth on the asset management plan. Similar to the generic expansion project discussion above, each growth-related project can have the following impacts:
· Initial construction funding (other than DCs)? The non-growth share of these projects can be significant and needs to be funded through other sources.
· Ongoing operating and maintenance costs, once the assets are purchased or constructed.
· Future rehabilitation or replacement costs.
These future lifecycle costs can be estimated within the asset management process and funded through the financing strategy.
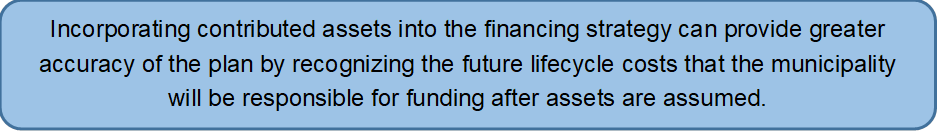
What method is used to incorporate contributed assets into the financing strategy?
Background
Contributed assets are typically assumed by a municipality as part of a development-related agreement or a donation. They can have a substantial impact on asset management plans since they need to be operated, maintained, and eventually replaced. However, there are other assets that are contributed or donated outside of the development process (e.g. from community groups) and these situations must be taken into account within the asset management plan as well.
For contributed assets, often key asset data related to costs, dates of construction/acquisition, material, remaining useful life, condition rating, etc., must be drawn from outside sources and may require some review by municipal staff for reasonableness and accuracy. This information forms the basis for the financial impact over the asset management forecast period.
Levels of Maturity – Contributed Assets
What method is used to incorporate contributed assets into the financing strategy?
At the basic level of maturity, municipalities incorporate their contributed assets into the financing strategy, but only after the assets have been assumed (i.e. from the developer or community group). The contributed assets, once assumed, would be recorded for asset management purposes. The lifecycle cost impact would then be able to be determined over the assets’ useful lives and included in the lifecycle management strategy. At this point, these impacts could be included in the financing strategy.
At the intermediate level of maturity, a more proactive approach is undertaken. Contributed assets are incorporated in the financing strategy based on staff analysis. The contributed assets would be recorded for asset management purposes before the date of assumption, based on staff estimates. Using these staff estimates, the lifecycle cost impacts of contributed assets over their useful lives can be included in the lifecycle management strategy, and from there, into the financing strategy.
At the advanced level of maturity, contributed assets would be incorporated into the asset management plan based on information obtained from approved development agreements. This would provide an opportunity for municipalities to record fairly detailed information about the contributed assets before the date of assumption. As with prior levels of maturity, the lifecycle cost impacts would then be included in the lifecycle management strategy, and from there, into the financing strategy.
Incorporating Contributed Assets into Financing Strategy
Information on future contributed assets can be difficult to obtain or estimate. Development agreements (and the developers themselves) can provide information on the assets that will be assumed by the municipality. However, date of assumption is usually based on the date when the terms and conditions of the development agreement are satisfied (which can be years after asset construction). This may delay the recording of contributed assets for accounting purposes, but it doesn’t have to delay recording the assets for asset management purposes. The moment information is known about a contributed asset (i.e. either development-related or other contributed assets), they can be established in the asset management plan.
Contributed assets can have the following asset management impacts:
· Initial purchase or construction (either fully or partially paid for by other parties): If there is a portion to be paid for by the municipality, what funding sources will be used?
· Ongoing operating and maintenance costs: What impact on these costs once the assets are assumed? Any operating costs before assumption?
· Future rehabilitation or replacement costs. As with any capital asset, contributed assets will need to be considered within the lifecycle management strategy to understand their future lifecycle needs.
These future lifecycle costs can be estimated within the asset management process, and funded through the financing strategy.
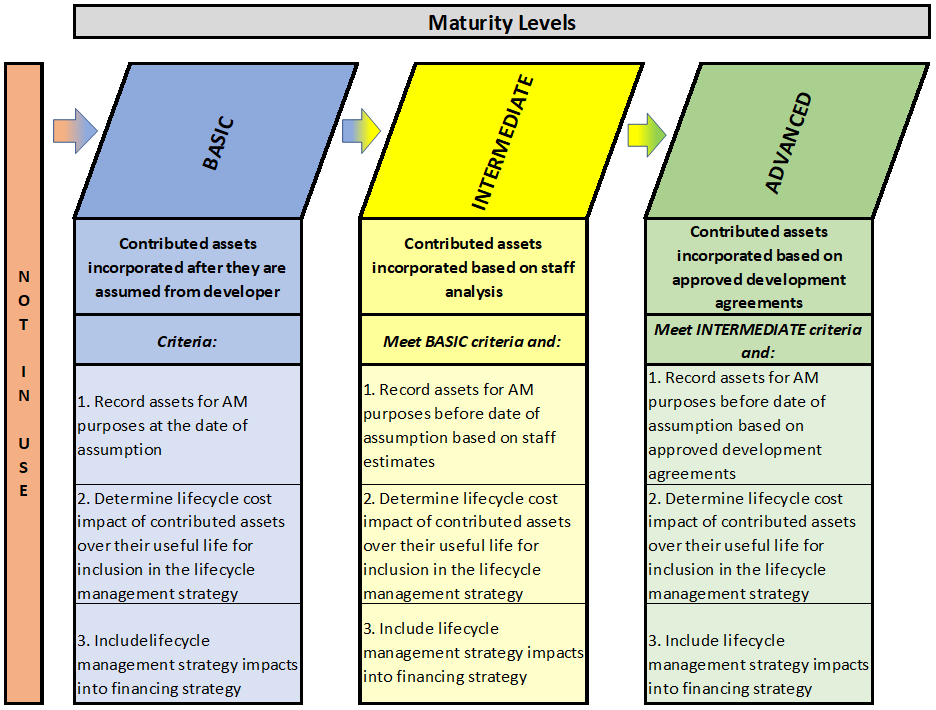
Does your financing strategy include a detailed debt analysis?
Background
In order to forecast and assess the impact of future activities on the operating budget and debt capacity, it is recommended that a detailed debt analysis be undertaken.
In cases where significant capital needs are identified, it may be beneficial to fund large expenditures through debt financing. This has the advantage of spreading the costs of costly capital projects over time so that current and future customers can share the burden. With debt financing, municipalities must consider:
· The annual repayment limit (ARL) imposed by the province;
· Whether internal debt limits need to be derived or updated;
· If existing debt strategies need to be revised (i.e. no debt policies);
· The impact of debt on future operating costs (i.e. debt principal and interest payments); and
· Intergenerational equity, whereby the timing of the benefits gained from acquiring/constructing capital assets does not correspond to the timing of the costs of paying off the related debt. This highlights that future generations will be responsible for impacts of both past and future assets.
Levels of Maturity – Debt Financing
Does your financing strategy include a detailed debt analysis?
At the basic level of maturity, municipalities perform a high-level analysis of their future debt needs and consider the impacts on future operating budgets. This can be accomplished by assessing how much debt will be required to be issued for proposed capital works and the anticipated timing of debt issuance. This will provide enough information to calculate estimated annual principal and interest payments. With these annual costs calculated, the impacts on the operating budget can be quantified and considered.
At the intermediate level of maturity, municipalities perform a high-level analysis of both its current and future debt needs and consider the impacts on future operating budgets. As with the basic level of maturity, the first step would be assessing the amount of debt required to be issued for proposed capital works and the anticipated timing of debt issuance. This will provide enough information to calculate estimated annual principal and interest payments for proposed debt, which could then be included with current debt principal and interest payments as part of a consolidated debt schedule or analysis. With these consolidated annual costs calculated, the impacts on the operating budget can be quantified and considered.
At the advanced level of maturity, municipalities perform a detailed analysis of both current and future debt needs, consider the impacts on future operating budgets, and additionally, include an annual repayment limit analysis. As with the previous levels of maturity, the first step would be assessing the amount of debt required to be issued for proposed capital works and the anticipated timing of debt issuance. This will provide enough information to calculate estimated annual principal and interest payments for proposed debt. Proposed debt principal and interest payments could then be included with current debt principal and interest payments as part of a consolidated debt schedule or analysis. With these consolidated annual costs calculated, a comparison to the estimated annual repayment limits in the future can be made to ensure compliance. Finally, the impacts of the consolidated debt costs on the operating budget can be quantified and considered.
Debt Analysis - Example
The following tables demonstrate an approach to preparing a debt schedule or analysis.
1. Determine
proposed debt financing required:
Table 6‑1
Sample Debt Financing Required
|
Description |
Forecast |
|||||||||
|
2018 |
2019 |
2020 |
2021 |
2022 |
2023 |
2024 |
2025 |
2026 |
2027 |
|
|
Capital Financing |
|
|
|
|
|
|
|
|
|
|
|
Provincial / Federal Grants |
- |
- |
- |
- |
- |
- |
- |
- |
- |
- |
|
Debt (Non-Growth) |
- |
550,000 |
900,000 |
700,000 |
500,000 |
400,000 |
250,000 |
200,000 |
- |
- |
|
Debt (Growth) |
- |
- |
- |
- |
- |
- |
- |
500,000 |
300,000 |
- |
|
Reserve Fund: Development Charges |
- |
30,000 |
- |
500,000 |
200,000 |
- |
40,000 |
- |
400,000 |
- |
|
Reserve Fund: Gas Tax |
220,000 |
220,000 |
220,000 |
220,000 |
220,000 |
220,000 |
220,000 |
220,000 |
220,000 |
220,000 |
|
Reserve Funds: Capital Related |
4,130,000 |
3,754,000 |
3,585,000 |
3,973,200 |
4,368,900 |
4,672,400 |
5,034,300 |
5,304,400 |
5,733,700 |
5,971,900 |
|
|
|
|
|
|
|
|
|
|
|
|
|
Total Capital Financing |
4,350,000 |
4,554,000 |
4,705,000 |
5,393,200 |
5,288,900 |
5,292,400 |
5,544,300 |
6,224,400 |
6,653,700 |
6,191,900 |
2. Estimate annual principal and interest payments for proposed debt (the following assumes debt over 20 years at 5%):
Table 6‑2
Sample Non-Growth Debt Payments – Principal and Interest
|
New Debt (Non-Growth) |
Principal (Inflated) |
Forecast |
|||||||||
|
Year |
2018 |
2019 |
2020 |
2021 |
2022 |
2023 |
2024 |
2025 |
2026 |
2027 |
|
|
2018 |
- |
|
- |
- |
- |
- |
- |
- |
- |
- |
- |
|
2019 |
550,000 |
|
|
44,133 |
44,133 |
44,133 |
44,133 |
44,133 |
44,133 |
44,133 |
44,133 |
|
2020 |
900,000 |
|
|
|
72,218 |
72,218 |
72,218 |
72,218 |
72,218 |
72,218 |
72,218 |
|
2021 |
700,000 |
|
|
|
|
56,170 |
56,170 |
56,170 |
56,170 |
56,170 |
56,170 |
|
2020 |
500,000 |
|
|
|
|
|
40,121 |
40,121 |
40,121 |
40,121 |
40,121 |
|
2023 |
400,000 |
|
|
|
|
|
|
32,097 |
32,097 |
32,097 |
32,097 |
|
2024 |
250,000 |
|
|
|
|
|
|
|
20,061 |
20,061 |
20,061 |
|
2025 |
200,000 |
|
|
|
|
|
|
|
|
16,049 |
16,049 |
|
2026 |
700,000 |
|
|
|
|
|
|
|
|
|
- |
|
2027 |
- |
|
|
|
|
|
|
|
|
|
|
|
Total Charges |
3,500,000 |
- |
- |
- |
44,133 |
116,352 |
172,522 |
212,643 |
244,740 |
264,801 |
280,849 |
Table 6‑3
Sample Growth Debt Payments – Principal and Interest
|
New Debt (Growth) |
Principal (Inflated) |
Forecast |
|||||||||
|
Year |
2018 |
2019 |
2020 |
2021 |
2022 |
2023 |
2024 |
2025 |
2026 |
2027 |
|
|
2018 |
- |
|
- |
- |
- |
- |
- |
- |
- |
- |
- |
|
2019 |
- |
|
|
- |
- |
- |
- |
- |
- |
- |
- |
|
2020 |
- |
|
|
|
- |
- |
- |
- |
- |
- |
- |
|
2021 |
- |
|
|
|
|
- |
- |
- |
- |
- |
- |
|
2020 |
- |
|
|
|
|
|
- |
- |
- |
- |
- |
|
2023 |
- |
|
|
|
|
|
|
- |
- |
- |
- |
|
2024 |
- |
|
|
|
|
|
|
|
- |
- |
- |
|
2025 |
500,000 |
|
|
|
|
|
|
|
|
40,121 |
40,121 |
|
2026 |
300,000 |
|
|
|
|
|
|
|
|
|
24,073 |
|
2027 |
- |
|
|
|
|
|
|
|
|
|
|
|
Total Charges |
800,000 |
- |
- |
- |
- |
- |
- |
- |
- |
40,121 |
64,194 |
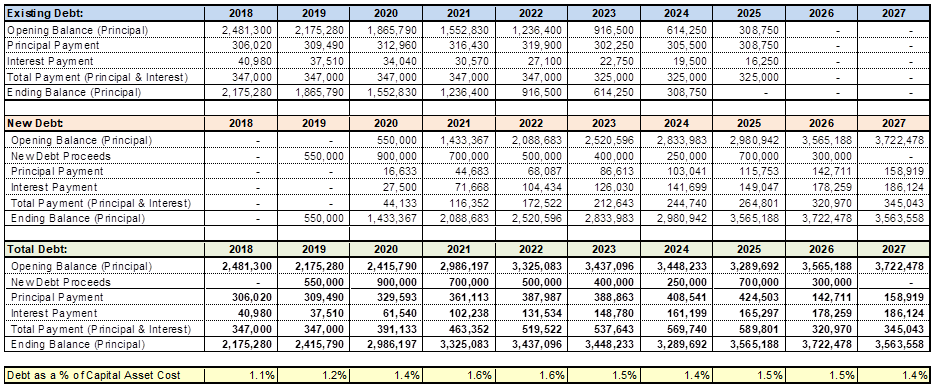
3. Prepare and consolidate continuity schedules for proposed and existing debt. This will result in a calculation of total debt principal and interest costs over the forecast period, with outstanding debt also projected for each year. The chart below also includes a ratio of total debt outstanding as a percent of ‘capital asset cost’ (i.e. TCA replacement cost), which can be also calculated as a financial indicator:
Table 6‑4
Sample Debt Continuity Schedules
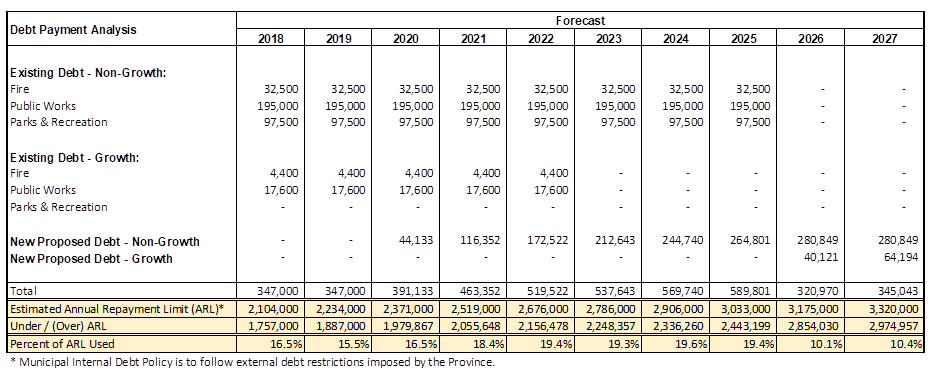
4. The estimated annual repayment limit (ARL) can be compared to the consolidated principal and interest from the debt schedule (above). It is important for annual projected debt payments to remain less than the ARL for each year. (Note: for proper calculation of projected ARL, schedule 81 of the Financial Information Return provides details. For this example, 25% of estimated future revenue was used):
Table 6‑5
Sample ARL/Debt Schedule Comparison

Does your financing strategy include a continuity schedule for all applicable reserve/reserve funds (RRF)?
Background
To forecast and assess the impact of future activities on reserves and reserves funds, municipalities should develop continuity schedules detailing projected:
· Opening balances;
· Contributions to/from reserves and reserve funds;
· Interest earned; and
· Closing balances.
These continuity schedules can then be compared to applicable reserve/reserve fund policies to ensure the use of the funds meets all requirements (such as minimum balances, optimal balances and how the funds are to be used).
Levels of Maturity – Reserve/Reserve Fund Planning
Does your financing strategy include a continuity schedule for all applicable reserve/reserve funds (RRF)?
At the basic level of maturity, municipalities only perform a high-level analysis of activities of significant reserves/reserve funds. Typically, this analysis would be restricted to determining the amount, use, and timing of proposed reserve/reserve fund contributions to fund capital within the financing strategy.
At the intermediate level of maturity, some analysis of the impact of future activities may be performed for significant reserves/reserve funds, including some detailed analysis. In addition to determining the amount, use, and timing of proposed reserve/reserve fund contributions to fund capital within the financing strategy, high-level reserve/reserve fund continuity schedules would be prepared for the forecast period. These schedules would include opening balances, transfers in/out, and closing balances. Municipalities could then quantify and consider impacts of proposed reserve/reserve fund activities on operating budgets.
At the advanced level of maturity, detailed analysis would be completed of future activities of all applicable reserves/reserve funds. In addition to determining the amount, use, and timing of proposed reserve/reserve fund contributions to fund capital within the financing strategy, detailed reserve/reserve fund continuity schedules would be prepared for the forecast period. These schedules would include opening balances, transfers in/out by type (including interest earned) and closing balances. The resulting projected reserve/reserve fund balances would be measured against optimal balance and/or minimum balance strategies. Performance measures would be identified to be compared to projected reserve/reserve fund balances to ensure the municipality is providing sufficient available funds for future commitments. For example, a municipality may decide that capital lifecycle reserve funds must reach a balance of at least 1% of the capital asset replacement cost within 10 years. Municipalities could then quantify and consider impacts of proposed reserve/reserve fund activities on operating budgets.
Reserves/Reserve Funds
Reserves and reserve funds are funds that have been set aside to meet future funding requirements. They may be set aside by Council by-law or legislation. Council may set up a reserve or reserve fund for any purpose for which they have the authority to spend money.
“Reserves” are set aside by Council at their own discretion to be available to meet future needs. These future needs do not have to be specific projects/assets and one reserve can serve multiple purposes. Generally, reserves do not accumulate interest earned on annual balances unless deemed by policy.
On the other hand, “reserve funds” are set up by Council resolution or by-law for a specific purpose, which makes them harder to reallocate to other uses. Reserve funds accumulate (accrue) interest earned on balances, thereby increasing the amount of future funding available. Reserve funds are considered either obligatory (i.e. required by legislation) or discretionary (i.e. set up at the discretion of Council).
Some strategies utilized to strengthen contributions to reserves and/or reserve funds are to:
· Transfer annual modified accrual (budget) surpluses to reserves and reserve funds. This approach can be applied within each self-sustaining fund (e.g. tax supported, water, wastewater, etc.); and
· When debt obligations get repaid, continue to include the annual debt servicing amounts in the budget and transfer the funds to reserves and reserve funds.
Lifecycle Reserve Funds
Lifecycle reserve funds are used to fund the ongoing capital replacement, rehabilitation, and preventive maintenance of capital assets over their useful lives. Contributions are typically calculated based on “sinking fund” calculations (to be discussed further in a later section). This requires an analysis to determine:
· Future replacement cost of capital assets;
· Assumed inflation applicable to the capital assets to be replaced; and
· Expected interest rates to be earned on reserve funds.
This calculation quantifies the annual funding required to pay for the future replacement or rehabilitation costs, when needed.
Federal/Provincial Transfer Payments (e.g. Gas Tax)
These types of reserve funds support municipal infrastructure projects that contribute to a number of national and provincial objectives. As an example, Table 6‑6 lists the federal gas tax funds national objectives. Federal funding is provided twice a year to provincial and territorial governments, or to the municipal associations which deliver this funding within a province. Projects are chosen locally and prioritized according to need. Municipalities can pool, bank, and borrow against this funding, providing significant financial flexibility. Gas tax funding received but not spent in any given year must be kept in a reserve fund that accrues interest annually.
Table 6‑6
Federal Gas Tax Fund National Objectives
|
Increased Economic Growth and Prosperity |
Cleaner Environment |
Stronger Cities and Communities |
|
Local Roads and Bridges |
Community Energy Systems |
Capacity Building |
|
Public Transit |
Drinking Water |
Disaster Mitigation |
|
Local and Regional Airports |
Wastewater |
Recreation Infrastructure |
|
Broadband Connectivity |
Solid Waste |
Culture Infrastructure |
|
Short-Sea Shipping |
Brownfield Redevelopment |
Tourism Infrastructure |
|
Short-Line Rail |
|
Sport Infrastructure |
Gas tax funds can be included as a stable and sustainable funding source within the asset management financing strategy.
Reserve/Reserve Fund Analysis - Example
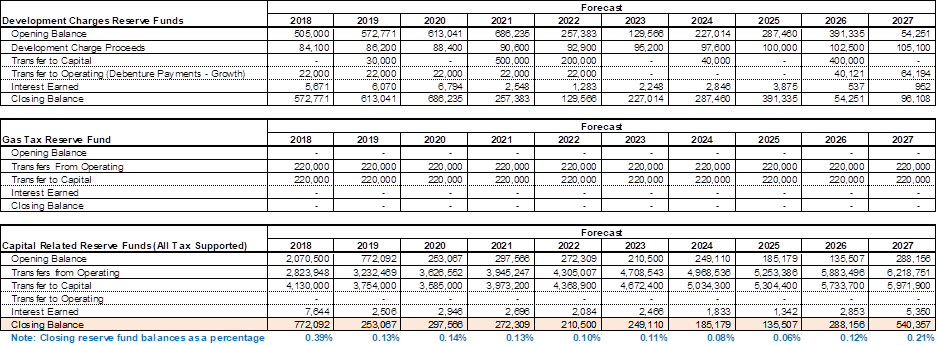
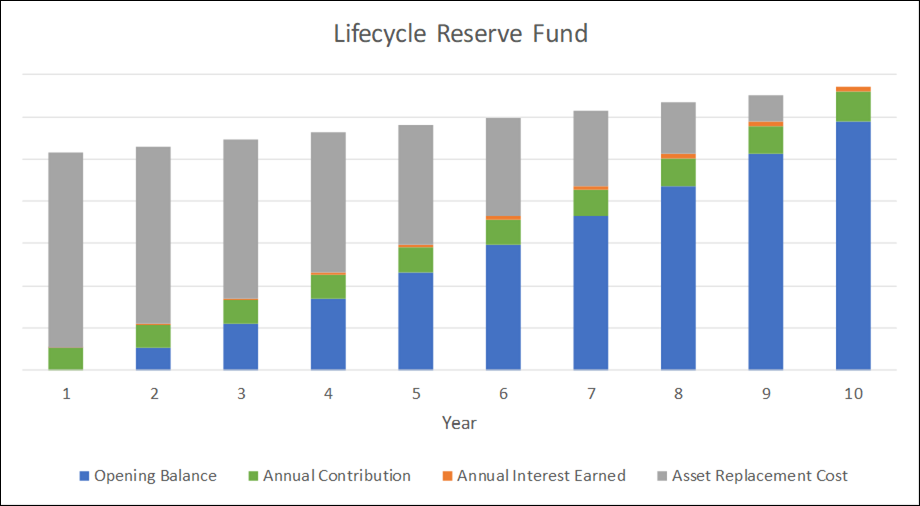
The following table provides sample reserve fund continuity schedules. The first two continuity schedules illustrate development charges reserve funds and gas tax reserve funds, respectively. The proceeds and use of these reserve funds will be restricted according to rules and regulations applying to each. For gas tax funds, the schedule is showing that the municipality will fully utilize all funds received each year.
The third sample continuity schedule illustrates a capital-related reserve fund. This reserve fund will have been established by the municipality as part of the asset management financing strategy. In this example, the municipality is working to increase the balance of this reserve fund such that it achieves its goal of 1% of capital asset replacement cost in ten years. This performance measure is displayed below the continuity schedule.
Table 6‑7
Sample RRF Schedules
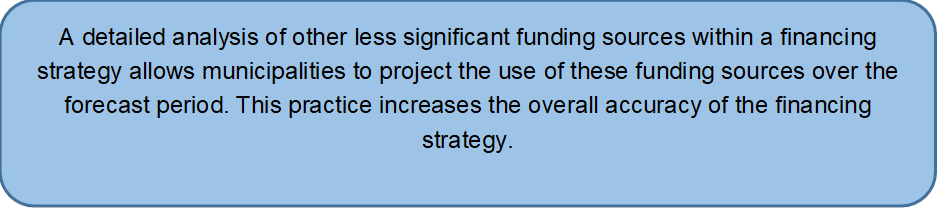
Does your financing strategy include a detailed analysis of other funding sources, such as donations, municipal act charges/landowner recoveries, grants, etc.?
Background
In addition to regularly utilized sources of funding, such as taxation, user fees, debt, and reserves/reserve funds, municipalities have limited opportunities to take advantage of other funding sources. These sources should not be overlooked when developing a financing strategy.
Levels of Maturity – Other Funding Sources
Does your financing strategy include a detailed analysis of other funding sources, such as donations, municipal act charges/landowner recoveries, grants, etc.?
At the basic level of maturity, municipalities incorporate a projection of other revenue sources based on historical levels into the financing strategy. A common method used to accomplish this would be the creation of a spreadsheet with historical costs input for other revenues. The forecasted amounts for other revenues would be simply based on percentage increase/decreases of the historical costs, based on staff estimates.
At the intermediate level of maturity, other revenue sources are incorporated into the financing strategy based on more detailed staff estimates. Typically, municipalities would start with a projection of other revenues based on historical revenue levels, but would then consider potential changes in related legislation, continuing availability of revenue source(s), and any other relevant factors. The projection of other revenues would be amended accordingly.
At the advanced level of maturity, other revenue sources are incorporated into the financing strategy in a more formal manner, with consideration for relevant existing/proposed agreements, contracts, or other source documents. Other revenues arising from these agreements and contracts would be calculated and included in the financing strategy. Where there are no agreements and contracts, staff would use their professional judgment to estimate the amounts and timing of other revenues.
Other Funding Sources
Grants
Current and proposed grant programs from other levels of government is one such source for which municipalities should keep attuned. It is important to understand the criteria for acceptance of capital projects for grant money. For example, many grant programs now require a formal asset management plan to be in place before any grant funds will be released. It is prudent for municipalities to ensure they have an early understanding of the criteria for acceptance when applying for grant funding. This preparation will help to ensure they are compliant with grant funding requirements as the grant programs become available, thereby avoiding any delays.
A municipality should not list grants as a funding source unless there is reasonable assurance that the grant will be approved and received. Including grants when they are not yet confirmed has the obvious effect of an overly optimistic financing strategy.
Local Improvement Charges
The legislation allowing for the imposition of local improvement charges provides an opportunity to fund capital from benefitting taxpayers under specific circumstances. There are instances when landowners in a municipality may specifically benefit from local improvements to sidewalks, roads, water systems, or wastewater systems. In these cases, a local improvement charge can be imposed by the municipality to cover all or part of the cost of construction. To help alleviate the financial burden on benefitting landowners, local improvement charges can be collected over a number of years, allowing financing terms and favourable interest rates. Municipalities contemplating a local improvement charge should consider whether the related capital works undertaken benefit only specific landowners or whether there is a more general benefit to the community. This may guide the decision as to whether a local improvement charge would be appropriate in the circumstances.
Fundraising
In some cases, citizen groups may have an interest in fundraising for community projects, such as recreation centres, libraries, park equipment, etc. Caution should be exercised in projecting anticipated funding from this source. Unless firm agreements are in place, with guaranteed amounts of funding identified, a conservative approach should be taken to quantifying donations as part of the financing strategy.
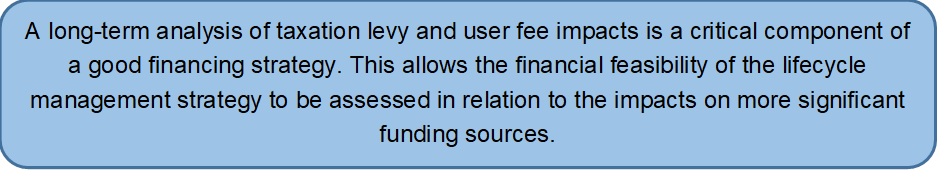
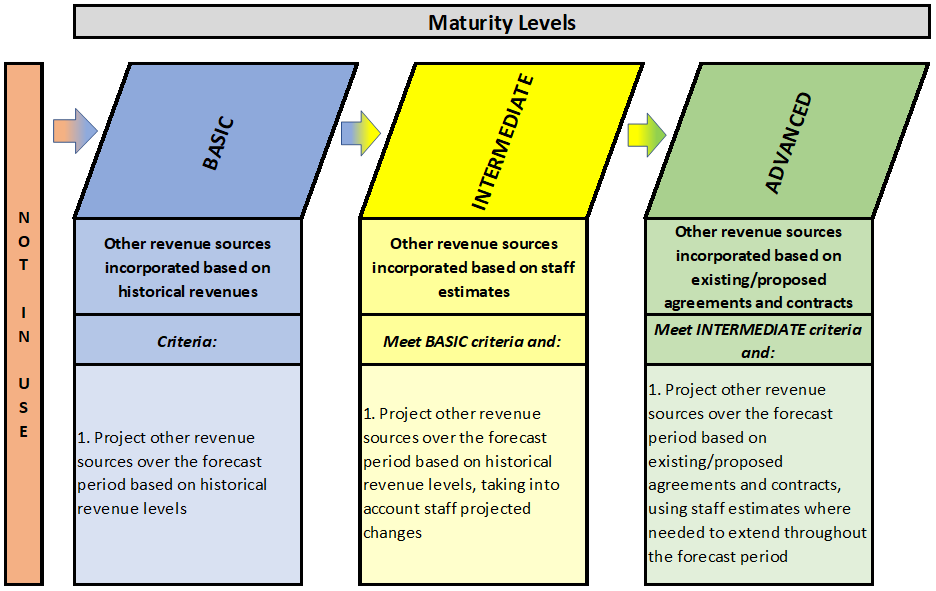
Does the financing strategy detail out a long-term impact analysis on taxation/user fees?
Background
An important part of any financing strategy is the determination of long-term impacts of funding strategies on tax rates and user fees, such as water and wastewater rates. Under the pay-as-you-go approach, tax rates and user fees are not impacted until capital investment occurs. Typically, this results in fluctuating budgetary impacts that can create large year-over-year differences. The additional cost of debt interest will also be incurred and have to be included in the operating budget.
Another approach is to create and maintain capital reserves/reserve funds to fund future capital expenditures. This has the advantage of providing a more predictable tax/user fee impact, with an opportunity for a more gradual year-over-year change. This approach also minimizes the cost of debt interest, especially in later years when reserves/reserve funds are more established. However, this methodology requires that tax/user fee budgets be increased in years prior to the capital investment being made.
One important tool in measuring the impact on rates of the different funding methods is the long-term rate impact analysis. A rate impact analysis may apply to tax rates or user fee rates. In order to assess the impacts of the various approaches to financing strategy, an analysis can be created that measures how varying amounts of contributions to capital, debt costs, and capital reserve transfers, as well as changes in levels of service, would affect the operating budget and rates over time.
Levels of Maturity – Rate Impacts
Does the financing strategy detail out a long-term impact analysis on taxation/user fees?
At the basic level of maturity, municipalities perform a high-level analysis of taxation/user fees impacts. This analysis would entail the determination of the annual amounts required from taxation or user fees to fund the lifecycle management strategy and compare this amount to the related current tax levy or user fee revenue. The resulting percentage would be considered the rate impact.
At the intermediate level of maturity, a detailed analysis of rate impacts is performed, but only for a short-term timeframe. This analysis first determines the annual amounts required from taxation or user fees to fund the lifecycle management strategy. A continuity schedule would be prepared for annual tax levies and/or user fee revenue, taking into account future assessment growth (taxation), changes in customer base (user fees), and operational impacts. Then, the identified funding requirements for the lifecycle management strategy would be introduced into the continuity schedule to determine the related rate impacts.
At the advanced level of maturity, a detailed analysis of rate impacts is performed over a long-term timeframe. This analysis would first entail the determination of the annual amounts required from taxation or user fees to fund the lifecycle management strategy. A continuity schedule would be prepared for annual tax levies and/or user fee revenue, taking into account future assessment growth (taxation), changes in customer base (user fees), and operational impacts. Then, the identified funding requirements for the lifecycle management strategy would be introduced into the continuity schedule to determine the related rate impacts.
Rate Impact Analysis - General
Figure 6‑3 (below) illustrates the general methodology used in determining a tax or user fee rate forecast:
Figure 6‑3
Methodology for Setting Rates/User Fees
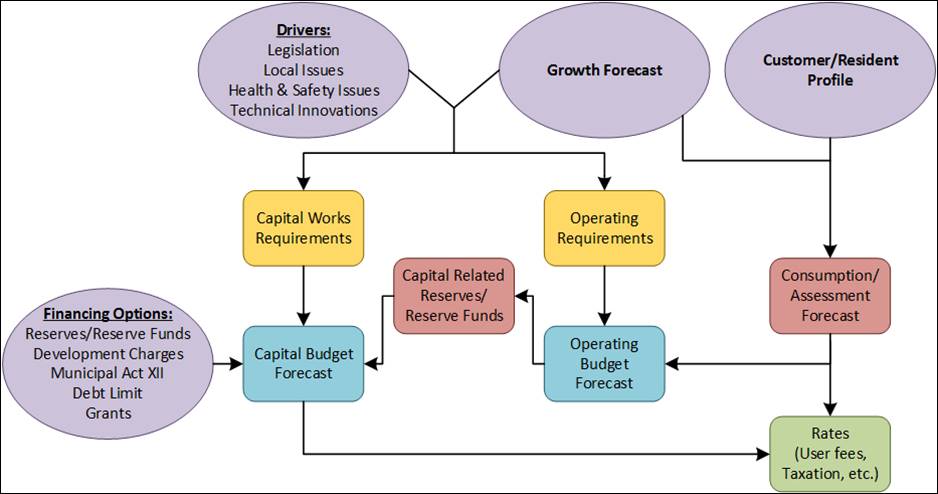
Tax Rate Impact Analysis
The methodology employed generally consists of 5 major elements:
1. Capital Budget Forecast
The capital budget is developed to measure program/service level adjustments, lifecycle requirements, and growth-related needs. Capital expenditures will consider capital asset renewal/rehabilitation, replacement, and expansion-related costs. The capital forecast should be developed with inflationary adjustments based on relevant capital costs indices.
2. Capital Funding Plan
The capital funding plan considers the potential funding sources available to address the capital needs forecast. The sources of capital funding include taxation-based support, reserves/reserve funds, debt for program/service level improvements, and grants. The use of funding from taxation is measured against the revenue projections and affordability impacts on taxpayers. Planned funding from reserve/reserve fund sources is measured against the sustainability of these funds relative to lifecycle demands, revenue projections, and affordability impacts. Debt financing is considered for significant capital expenditures when funding is required beyond long-term lifecycle needs, or to facilitate rate transition policies. Projected impacts of debt financing should be measured against the municipality’s debt policies and annual repayment limits to ensure a practical and sustainable funding mix.
3. Operating Budget Forecast
The operating budget forecast considers adjustments to the municipality’s base budget by reflecting program/service level changes, operating fund impacts associated with infrastructure, and financing for capital needs. The operating expenditures should be forecast with inflationary adjustments and growth in service demand, based on fixed and variable cost characteristics. The operating budget forecast ties the capital funding plan and reserve/reserve fund continuity forecast to the rate-based revenue projections. This ensures sufficient funding for both the ongoing annual operation and maintenance of services supported by taxation, as well as the capital cost requirements, to ensure appropriate service delivery. Tax revenues are projected, net of anticipated operating revenues, such as user fees, rental fees, and other miscellaneous revenues.
4. Assessment Forecast
The assessment forecast is developed based on current assessment with assumed future assessment growth applied over the forecast period. Consideration should be given to known or expected future developments and the anticipated impact on assessment.
5. Tax Rate Forecast
At this stage in the analysis, the full costs of services supported by taxation are measured against total tax assessment with projected growth incorporated to determine anticipated tax rate increases.
User Fee Rate Impact Analysis
Figure 6‑3 also applies to the general methodology used in determining the full cost recovery of user fees, such as water and wastewater rates.
The methodology employed generally consists of 5 major elements:
1. Customer Demands and Consumption Forecast
This first step in the analysis is important as it calculates the current base revenue by source and all assumptions for forecasting purposes. Any base charge revenues are forecast with customer growth. The customer profile forecast is modeled based on a municipality’s anticipated growth forecast, by customer type. Moreover, the customer forecast is modelled for the user fee systems independently to identify differences in service demands, if any.
The consumption forecast (e.g. water) is developed by applying average annual consumption estimates to future development. The consumption estimates are based on average consumption levels by customer type, as found in customer records. The forecast may adjust the base consumption levels for anticipated conservation based on historical trends and practices witnessed in industry.
2. Capital Budget Forecast
The capital budget is developed to measure program/service level adjustments, lifecycle requirements, and growth-related needs. Capital expenditures will consider capital asset renewal/rehabilitation, replacement, and expansion-related costs. The capital forecast should be developed with inflationary adjustments based on relevant capital costs indices.
3. Capital Funding Plan
The capital funding plan considers the potential funding sources available to address the capital needs forecast. The sources of capital funding include rate-based support, reserves/reserve funds, debt for program/service level improvements, and grants. The use of rate-based funding is measured against the revenue projections and affordability impacts on ratepayers. The reserve/reserve fund sources are measured against the sustainability of these funds relative to lifecycle demands, revenue projections, and affordability impacts. Debt financing is considered for significant capital expenditures where funding is required beyond long-term lifecycle needs, or to facilitate rate transition policies. Debt financing projected impacts should be measured against the municipality’s debt policies and annual repayment limits to ensure a practical and sustainable funding mix.
4. Operating Budget Forecast
The operating budget forecast considers adjustments to the municipality’s user rate base budget by reflecting program/service level changes, operating fund impacts associated with infrastructure, and financing for capital needs. The operating expenditures are forecast with inflationary adjustments and growth in service demand, based on fixed and variable cost characteristics. The operating budget forecast ties the capital funding plan and reserve/reserve fund continuity forecast to the rate-based revenue projections. This ensures sufficient funding for both the ongoing annual operation and maintenance of water and wastewater services, as well as the capital cost requirements, to ensure service sustainability. Operating revenues are projected to identify the base charge and consumptive rate components net of anticipated operating revenues, such as connection fees, rental fees, and other miscellaneous revenues.
5. Rate Forecast and Structure
The rate forecast and structure component of the analysis considers various rate structures that could be utilized to recover the forecast rate-based revenue from the projected customer demands. At this stage in the analysis the full costs of service are measured against the customer growth and consumption demands to determine full cost recovery rates. The analysis may consider alternative structures for base charge and consumptive components of the rates, consistent with municipal policies/strategies, industry practice, and customer affordability.
Rate Impacts – Example
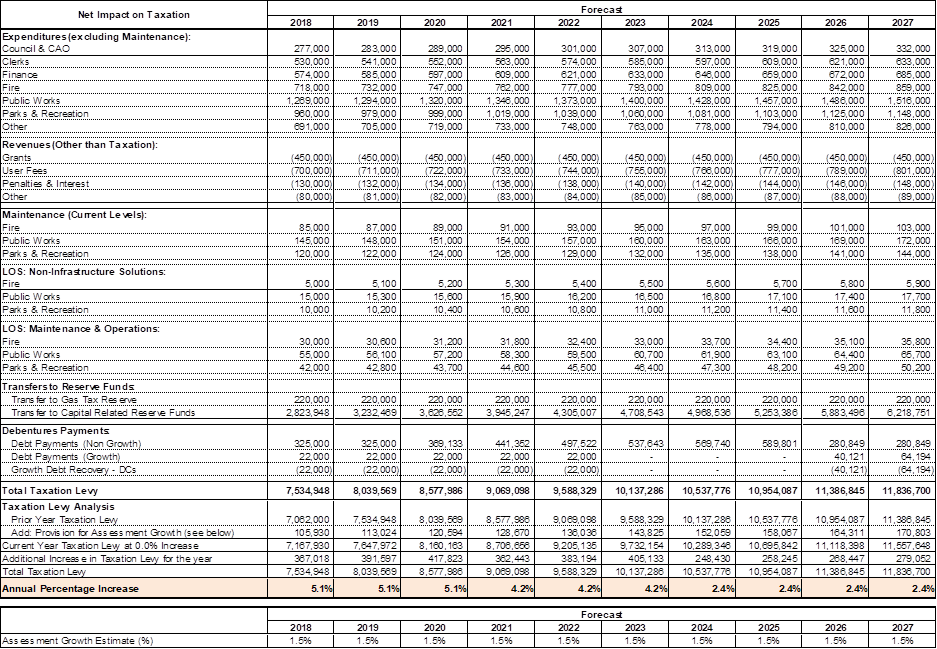
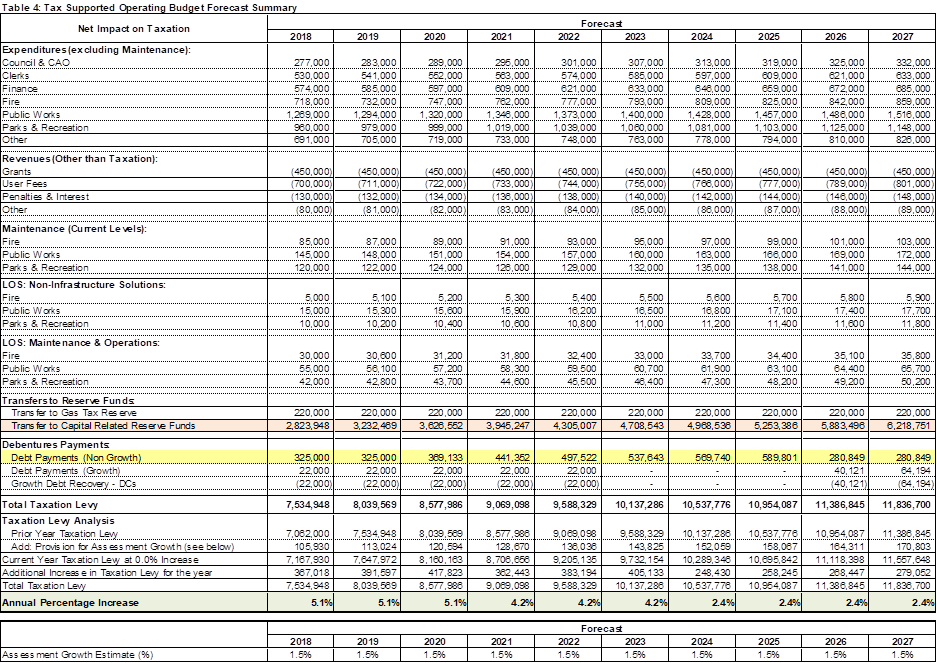
In order to project rate impacts (either taxation or user fee) due to activities related to asset management, a financial forecast will need to be created. In order to represent asset management impacts clearly in the forecast, it is advisable to separately report costs by lifecycle category. In the example tax rate forecast below, maintenance and non-infrastructure solutions are each detailed separately from existing operational costs. Since levels of service (LOS) decisions relate to asset management strategies, they have also been separately reported in the forecast. Table 6‑8 represents the LOS impacts considered for this example.
Table 6‑8
Sample Rate Impact Analysis – LOS Impacts
|
|
Levels of Service (LOS) Analysis |
||||
|
Current LOS |
Expected LOS |
Type |
Est. Cost to Move to Exp. LOS |
Cost Description |
|
|
Fire |
Fire equipment inspections twice per year |
Fire equipment inspections monthly |
Non-Infrastructure Solution |
5,000 |
Staff time |
|
Current fire vehicle maintenance schedule |
Accelerated fire vehicle maintenance schedule |
Maintenance |
30,000 |
Maintenance costs, staff time |
|
|
Public Works |
No demand management program re. use of private cars |
Institute demand management program to promote alternative transportation choices other than private cars |
Non-Infrastructure Solution |
15,000 |
Promotional material, advertising in media, staff time |
|
Crack and Seal Program – based on visual inspection (5%/yr.). Collector / Arterial Rds. – within 2 yrs. of resurface. Other Roads – at 20 yrs. |
Expand Crack and Seal and Patching Program – based on visual inspection (10%/yr.). Collector / Arterial Rds. – within 1 yr. of resurface. Other Roads – at 10 yrs. |
Maintenance |
55,000 |
Staff time, materials |
|
|
Parks and Recreation |
No discounts for non-peak hours at recreation facilities |
Introduce discounts for non-peak hours at recreation facilities |
Non-Infrastructure Solution |
10,000 |
Loss of revenues |
|
Current facility maintenance program |
Accelerated facility maintenance program |
Maintenance |
42,000 |
Materials, contractor costs |
|
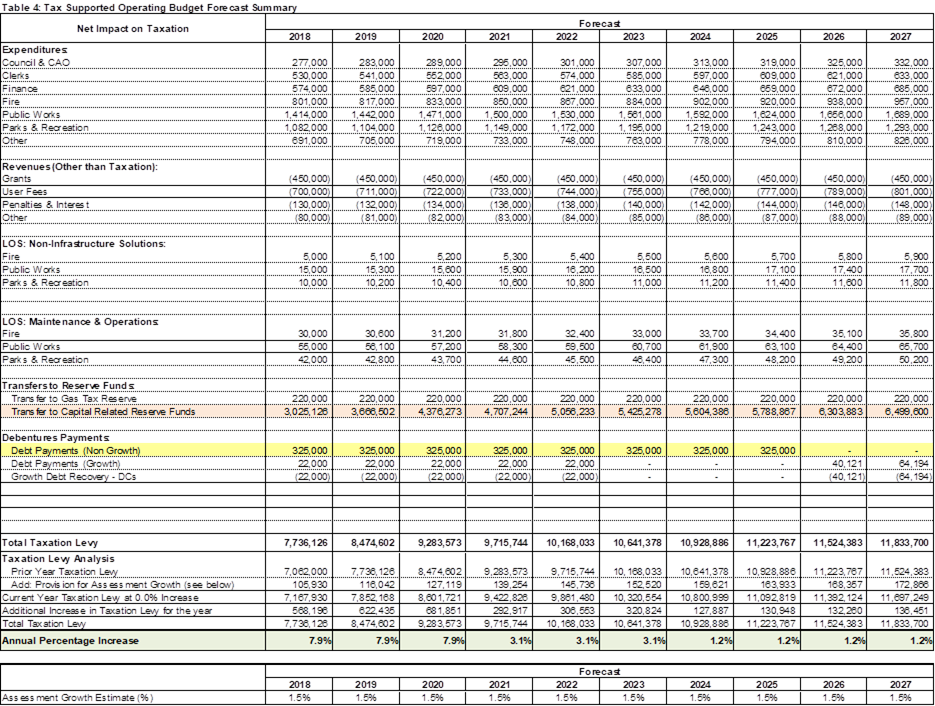
The forecast (Table 6‑9 below) should be created such that the tax levy (or user fee revenue, if applicable) is calculated for each year of the forecast period. In the forecast, the total annual taxation levy line is highlighted. It is also recommended that any projected assessment growth (for taxation forecasts) or consumption growth (for user fee forecasts) be accounted for. The assumptions for assessment growth are included at the end of the forecast below.
Once the above information is completed, the tax rate impact (or user fee impact, if applicable) can be determined. The annual percentage increase has also been highlighted in the forecast below.
Table 6‑9
Sample Rate Impact Analysis
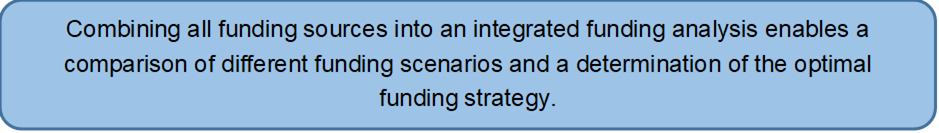
Does your financing strategy combine all individual funding source analyses into an integrated combined analysis?
Background
Any financing strategy includes interaction between the capital forecast, debt forecasts, reserve and reserve fund forecasts, and operating forecasts. Figure 6‑4 (below) illustrates this interaction:
Figure 6‑4
Integrated Financing Strategy Interactions
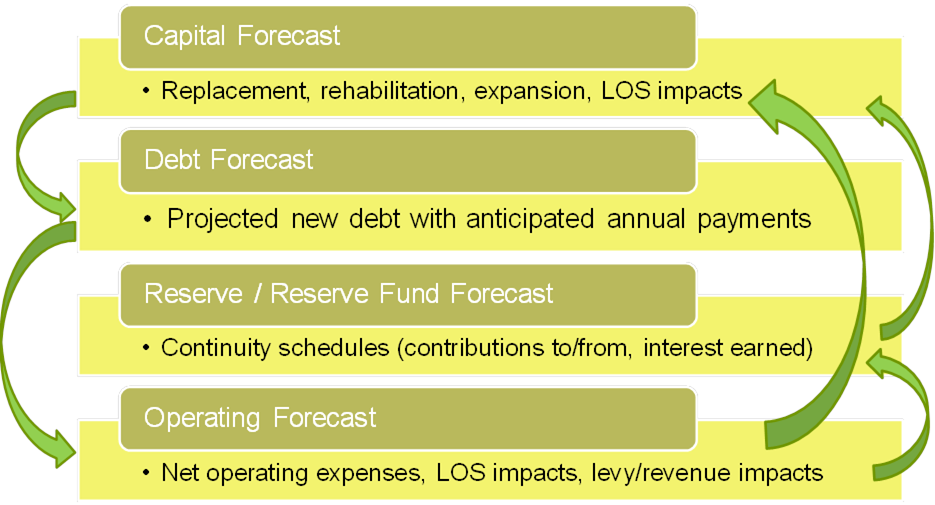
In this figure, all four sections can potentially impact each other. If the financing strategy can be modelled so that these impacts are automated, it makes balancing the financing strategy much easier.
Once the mechanisms are in place to perform an integrated funding analysis, the opportunity to assess and compare the results of different funding scenarios becomes available. It is this opportunity that puts the municipality in the best position to determine an optimal financing strategy.
Levels of Maturity – Revenue Reporting
Does your financing strategy combine all individual funding source analyses into an integrated combined analysis?
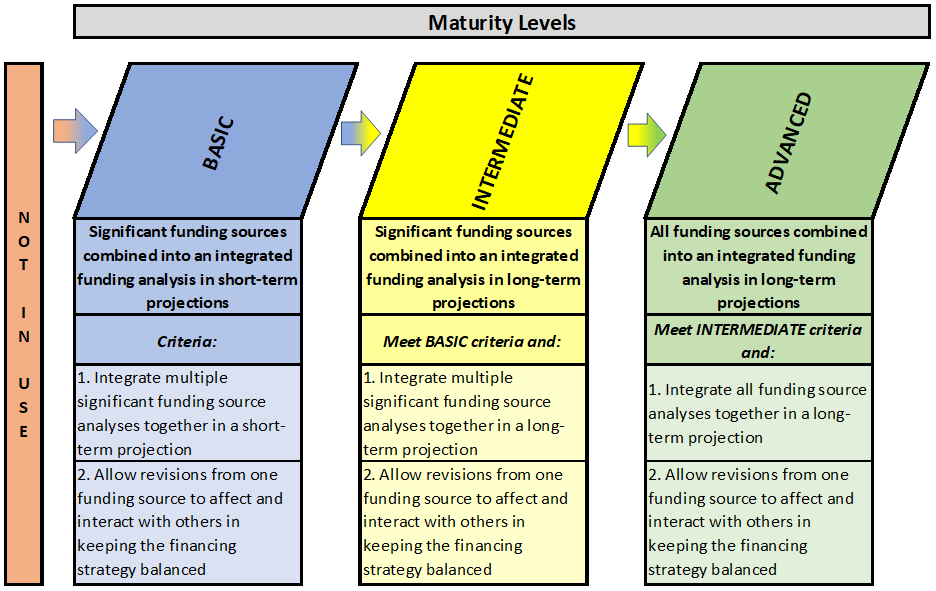
At the basic level of maturity, municipalities combine significant funding sources into an integrated funding analysis as part of short-term projections. Typically, this would be accomplished by integrating multiple significant funding source analyses together in a table. The table would only be used for short-term projections. Different funding scenarios could be assessed by varying the amounts of one funding source (e.g. debt financing) and ascertaining what impacts would be required on other funding sources (e.g. reserves/reserve funds, contributions from operating, etc.) to keep the financing strategy in balance.
At the intermediate level of maturity, municipalities combine significant funding sources into an integrated funding analysis as part of long-term projections. Typically, this would be accomplished by integrating significant funding source analyses together in a table. The table would be developed to represent long-term projections. Different funding scenarios could be assessed by varying the amounts of one funding source (e.g. debt financing) and ascertaining what impacts would be required on other funding sources (e.g. reserves/reserve funds, contributions from operating, etc.) to keep the financing strategy in balance.
At the advanced level of maturity, municipalities combine all funding sources into an integrated funding analysis as part of long-term projections. Typically, this would be accomplished by integrating all funding source analyses together in a table. The table would be developed to represent long-term projections. Different funding scenarios could be assessed by varying the amounts of one funding source (e.g. debt financing) and ascertaining what impacts would be required on other funding sources (e.g. reserves/reserve funds, contributions from operating, etc.) to keep the financing strategy in balance.
Integrated Funding Analysis – Example
To demonstrate an integrated funding analysis, consider the following assumptions:
· A municipality anticipates capital needs of $35.3 million over five years and $63.3 million over ten years to meet optimal expected levels of service.
· Due to fiscal constraints, some capital works are deferred until later years. Only $24.3 million is considered available to be completed within five years and $54.2 million within ten years.
· This creates an infrastructure gap representing the amount required to be spent to bring the assets up from current levels of service to optimal expected levels of service. This is summarized in Table 6‑10 below:
Table 6‑10
Sample Integrated Funding Analysis
|
Category |
Optimal Expected LOS |
Scenario 1 Capital Deferral, Use of External Debt |
Scenario 2 Capital Deferral, No External Debt |
|
Capital (Inflated) over 5 Years |
$35,300,000 |
$24,291,100 |
$24,291,100 |
|
Capital (Inflated) over 10 Years |
$63,300,000 |
$54,197,800 |
$54,197,800 |
|
Infrastructure Gap (Inflated) |
None |
$11,008,900 – First 5 Years |
$11,008,900 – First 5 Years |
|
$9,102,200 – Next 5 Years |
$9,102,200 – Next 5 Years |
For the purposes of this example, the municipality is considering two scenarios:
1. Issue $3.5 million in debt for non-growth capital expenditures; or
2. No debt to be issued.
Scenario 1 – Issue $3.5 Million in Debt over Ten Years:
The following represents the capital forecast for ten years (2018 to 2027), with capital financing including a total of $3.5 million in new debt for projects not related to growth. (Note: debt financing for growth-related projects in the total amount of $800,000 in 2025 and 2026 is assumed to represent internally financed debt via DCs).
The impacts of the new debt issuance are highlighted in yellow in the tables. Transfers between funds which are affected by the different financing scenarios are colour coded to match. In this way, the key differences between scenarios can be more easily identified.
Table 6‑11
Scenario 1 – Supported Capital Forecast
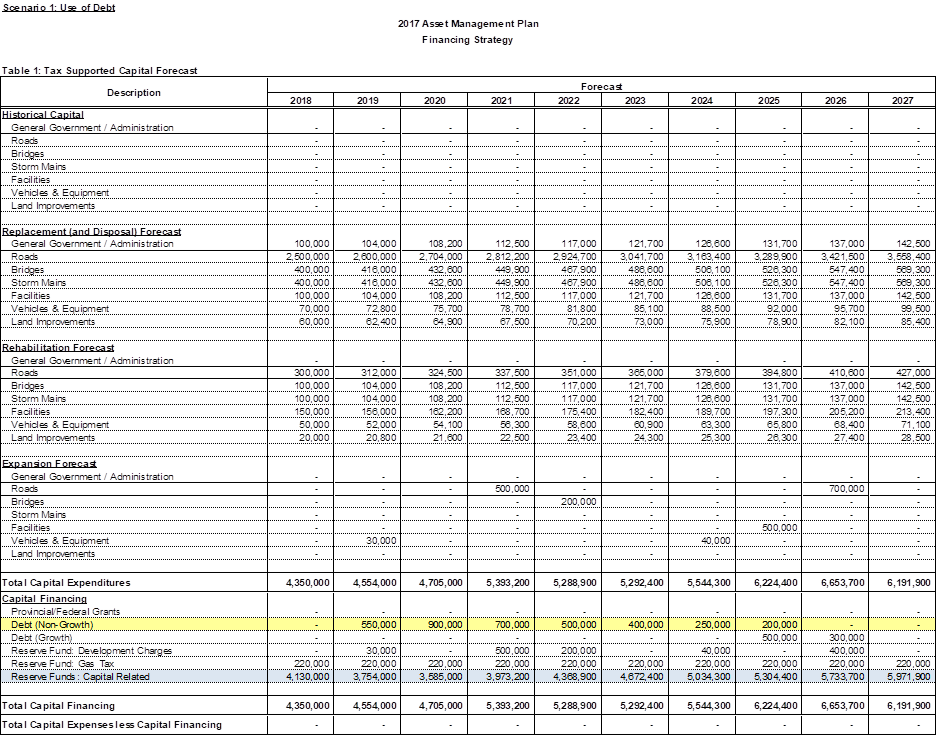
Table 6‑12
Scenario 1 – Debt Schedules
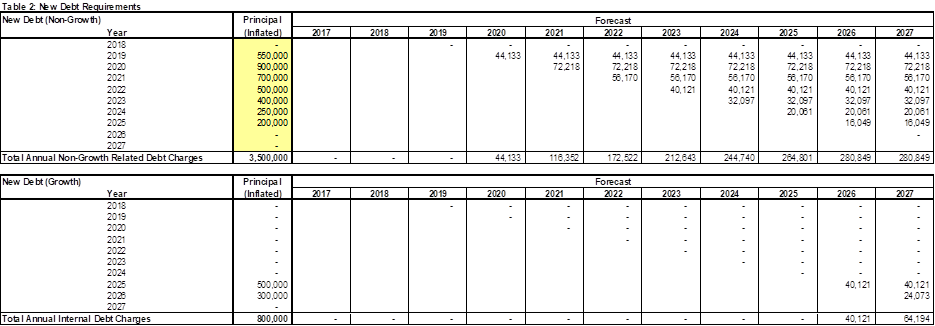
Table 6‑13
Scenario 1 – Reserve/Reserve Fund Schedules
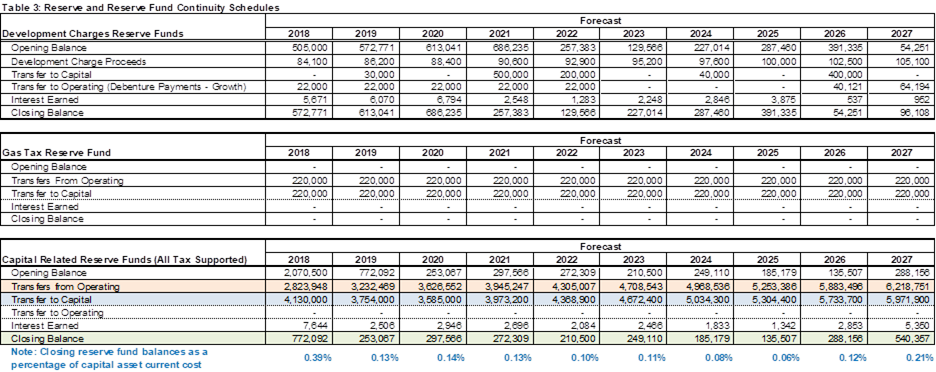
Table 6‑14
Scenario 1 – Operating Budget Summary
Scenario 2 – No Debt
The following represents the capital forecast for ten years (2018 to 2027) with no debt issued. (Note: debt financing for growth in the total amount of $800,000 in 2025 and 2026 represents internally financed debt via DCs).
The impacts of the municipality not issuing new debt are highlighted in yellow in the tables. Transfers between funds which are affected by the different financing scenarios are colour coded to match. In this way, the key differences between scenarios can be more easily identified.
Table 6‑15
Scenario 2 – Supported Capital Forecast
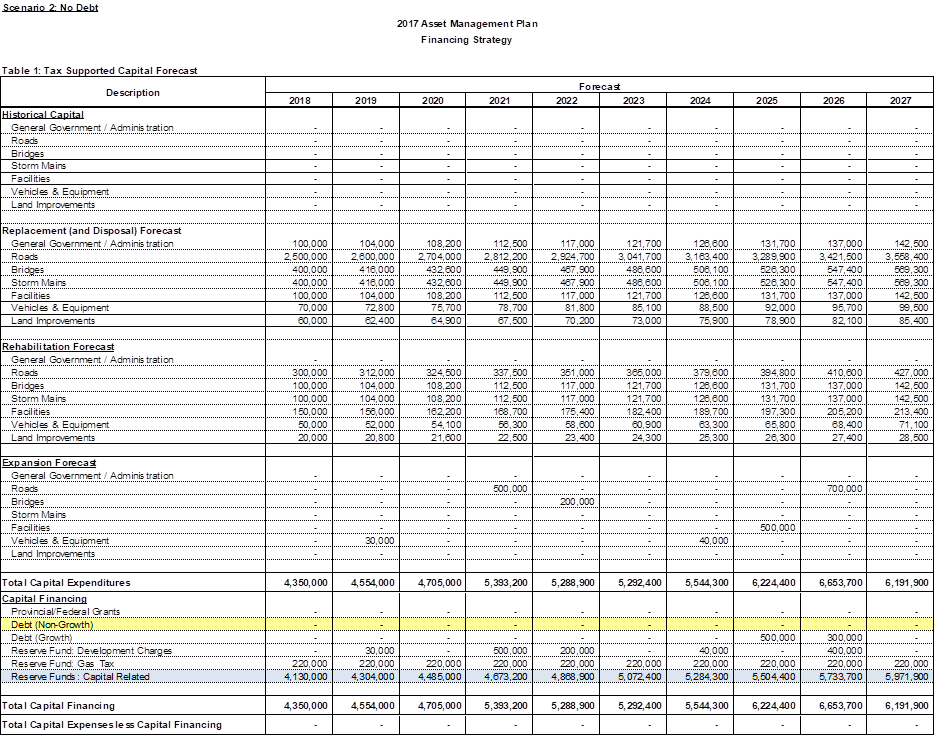
Table 6‑16
Scenario 2 – Debt Schedules
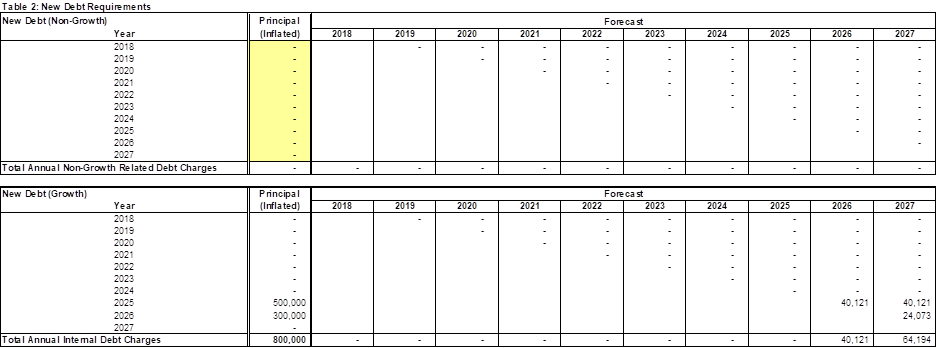
Table 6‑17
Scenario 2 – Reserve/Reserve Fund Schedules
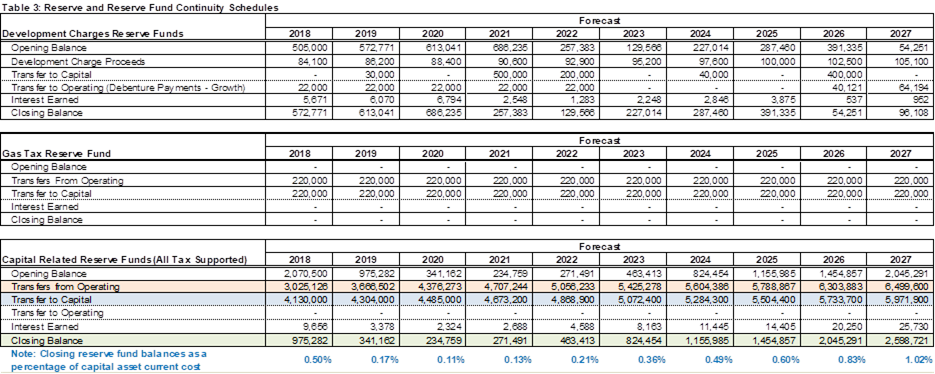
Table 6‑18
Scenario 2 – Operating Budget Summary
Comparison of Scenarios
The above analyses allow the municipality to better assess the impacts of the two financing strategies. Table 6-19 (below) summarizes the results.
Table 6‑19
Scenario Impact Comparison
|
Category |
Optimal Expected LOS |
Scenario 1 Capital Deferral, Use of External Debt |
Scenario 2 Capital Deferral, No External Debt |
|
Capital (Inflated) over 5 Years |
$35,300,000 |
$24,291,100 |
$24,291,100 |
|
Capital (Inflated) over 10 Years |
$63,300,000 |
$54,197,800 |
$54,197,800 |
|
External Debt Issued (Non-Growth) |
|
$3,500,000 |
- |
|
Capital Reserve Funds – After 10 Years |
|
$540,357 |
$2,598,271 |
|
2027 Reserve Fund Balance, % Asset Cost |
|
0.21% |
1.02% |
|
Tax Rate Impacts (Annual % Increase) |
|
5.1% - First 3 Years |
7.9% - First 3 Years |
|
|
4.2% - Next 3 Years |
3.1% - Next 3 Years |
|
|
|
2.4% - Last 4 Years |
1.2% - Last 4 Years |
|
|
Infrastructure Gap |
None |
$11,008,900 – First 5 Years |
$11,008,900 – First 5 Years |
|
$9,102,200 – Next 5 Years |
$9,102,200 – Next 5 Years |
Depending on the municipality’s financial targets, an assessment can be made as to the most optimal financing strategy. Decisions can be made related to the sensitivity to rate impacts, the level of reserve fund availability, and debt levels over the forecast period.
Are clear capital priorities established in the short-term within the Financing Strategy?
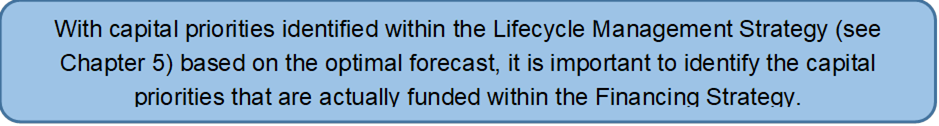
Background
Including funded capital priorities within the Financing Strategy allows municipal staff to identify what capital priorities included in the Lifecycle Management Strategy are actually unfunded versus funded. This assists in outlining the consequences of not being able to fund the optimal long-term forecast.
Levels of Maturity – Identifying Funded Capital Priorities
Are clear capital priorities established in the short-term within the Financing Strategy?
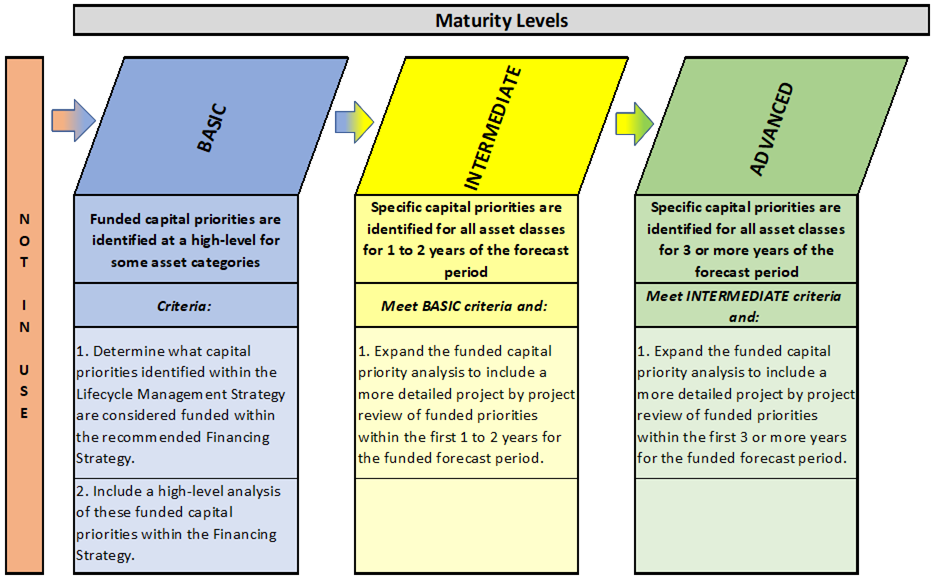
At the basic level of maturity, municipalities include a high-level analysis of capital priorities that are funded within the Financing Strategy. This analysis would be non-project specific and/or provide no timing with respect to the priorities.
At the intermediate level of maturity, the analysis of capital priorities that are funded will be more detailed within the Financing Strategy. This would include project or asset specific priorities and be outlined based on timing of the priority. Priorities would be identified as funded for 1 to 2 years of the funded forecast period.
At the advanced level of maturity, the analysis of capital priorities that are funded will be more detailed within the Financing Strategy. This would include project or asset specific priorities and be outlined based on timing of the priority. Priorities would be identified as funded for 3 or more years of the funded forecast period.
Funded Capital Priorities
Capital priority identification, as discussed in Chapter 5, is critical in that it provides valuable information relating to:
· Determining capital projects or assets to include in upcoming budgets;
· Identifying capital projects or assets to fund through Gas Tax Funding; and
· Selecting which capital projects or assets to include in Provincial grant funding applications.
Capital project or asset priorities are identified within the Lifecycle Management Strategy (see Chapter 5) under the preferred or optimal forecasts discussion. If these forecasts can’t be fully funded under the recommended Financing Strategy, then it is important to outline the funded versus unfunded components of the priority list. This funded identification can play a number of important roles:
· Ensure Council, the public and other stakeholders understand the implications of not funding the optimal forecast; and
· Identify capital projects or assets that should be funded, if additional funding becomes available (such as grants).

Does your financing strategy include a detailed analysis of your infrastructure funding gap?
Background
Identifying and analyzing the various infrastructure funding gaps within an asset management process provides a significant performance/sustainability measure that can be used to measure the overall success of the recommendations within the entire AM process.
Levels of Maturity – Infrastructure Funding Gap
Does your financing strategy include a detailed analysis of your infrastructure funding gap?
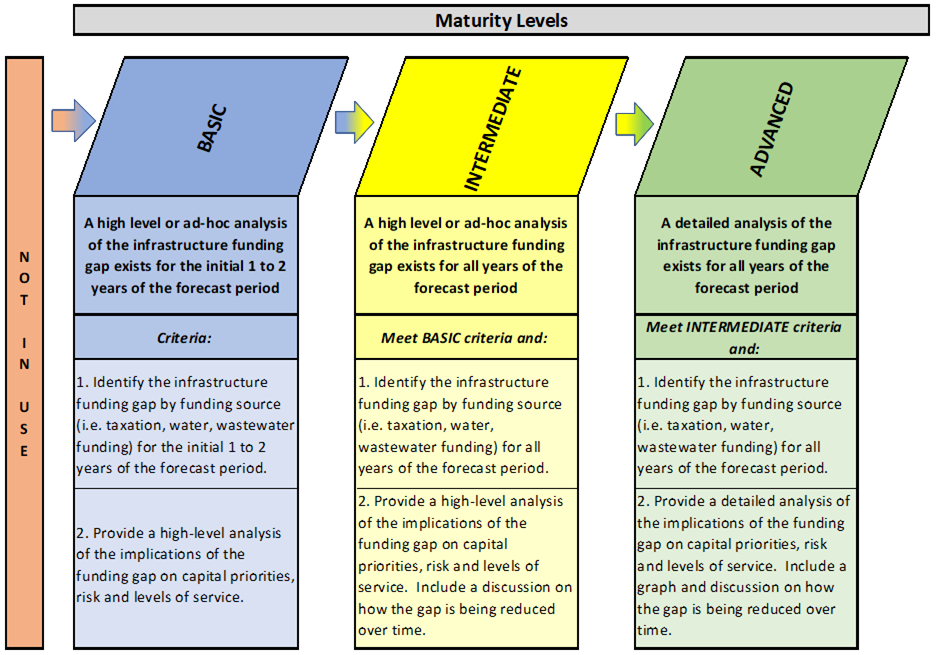
At the basic level of maturity, municipalities identify the infrastructure funding gaps for the first 1 to 2 years of the forecast period. This calculation would typically be carried out for preferred financing strategies in order to provide a metric for assessing the relative impacts of these financing strategies. A high-level analysis and discussion on the infrastructure funding gap would be included.
At the intermediate level of maturity, municipalities identify the infrastructure funding gaps for all years of the forecast period. This calculation would typically be carried out for preferred financing strategies in order to provide a metric for assessing the relative impacts of these financing strategies. A high-level analysis and discussion on the infrastructure funding gap would be included, including a discussion of how the funding gaps are being reduced over time.
At the advanced level of maturity, municipalities identify the infrastructure funding gaps for all years of the forecast period. This calculation would typically be carried out for preferred financing strategies in order to provide a metric for assessing the relative impacts of these financing strategies. A detailed analysis and discussion on the infrastructure funding gap would be included, including a discussion of how the funding gaps are being reduced over time. This information would be shown visually (i.e. graphically) within the Financing Strategy.
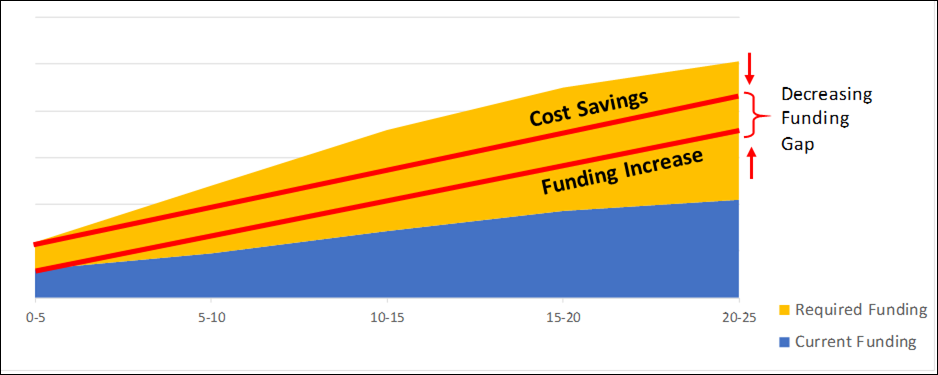
Infrastructure Funding Gap
As part of a long-term funding strategy, municipalities should determine the level of annual investment in capital assets that is required as determined by the asset management plan and compare to the amount of annual capital investment included in the operating budget/forecast. The difference between these amounts represents the annual infrastructure funding gap. This is illustrated in Figure 6‑5 (below). In order to reduce the gap, either some cost savings must be achieved in the overall required lifecycle costs, or the amount of the annual capital funding must be increased.
Figure 6‑5
Sample Infrastructure Funding Gap
A fundamental approach to calculating the cost of using a capital asset, and for the provision of the revenue required when the time comes to retire and replace it, is the “sinking fund method”.
· This method first estimates the future replacement cost of the asset at the time of replacement by inflating the current replacement cost of the asset at an assumed annual capital inflation rate.
· A calculation is then performed to determine annual contributions which, when invested in a reserve fund, will grow with interest to a balance equal to the future replacement cost.
· The contributions are calculated such that they also increase annually with inflation.
· Under this approach, an annual capital investment amount is calculated where funds are available for short-term needs while establishing a funding plan for long-term needs.
· Annual contributions in excess of capital costs in a given year would be transferred to a “capital replacement reserve fund” for future capital replacement needs.
· This approach provides for a stable funding base and eliminates variances in annual funding requirements, particularly in years when capital replacement needs exceed typical capital levy funding. Please refer to Figure 6‑6 (below) for an illustration of this method.
Figure 6‑6
Sinking Fund Method
Under this approach, funding is available in reserves/reserve funds based on the estimated date of requirement. This methodology represents the “reserve/reserve fund” financing strategy discussed earlier in this chapter and would not be used by municipalities under a “pay as you go” strategy. Alternatively, a hybrid approach can be used where a portion of the lifecycle costs are planned for in reserve/reserve fund contributions, with other portions treated as “pay as you go” strategy.
An illustrative example of a funding gap diagram is as follows:
Example – Funding Gap
In order to mitigate the funding gap (as defined above), it is typical to approach it with a long-term view. A multi-year plan could be instituted which would allow for annual contributions that increase steadily such that the annual funding deficit shrinks.
The figures below represent the funding gaps resulting from the scenarios outlined in the previous sections. It is assumed that the municipality represented in this example wishes to mitigate its infrastructure funding gap by the year 2027 under either scenario.
In these figures, the different components of capital investment are stratified by colour, which indicate:
· Blue: Current capital investment amounts, shown increasing at inflationary levels;
· Green: Grants that are expected to remain consistent over the forecast period;
· Light Orange: External debt maintaining slightly above historical levels until later in the forecast period then decreasing;
· Dark Orange: Indicates the result of implementing recommended increases in available funding sources as outlined within the asset management financing strategy (resulting in increases in capital investment annually); and
· Grey: Represents optimal annual capital investment amounts (as defined/described above). Please note “optimal” capital investment funding can come from a number of additional sources, such as grants, donations, and other contributions.
As can be seen from the figures, the infrastructure funding gap continues to 2027 under Scenario 1. However, under scenario 2 where no additional debt is issued, the gap is mitigated by the year 2023.
Figure 6‑7
Scenario 1 – Annual Infrastructure Funding Gap
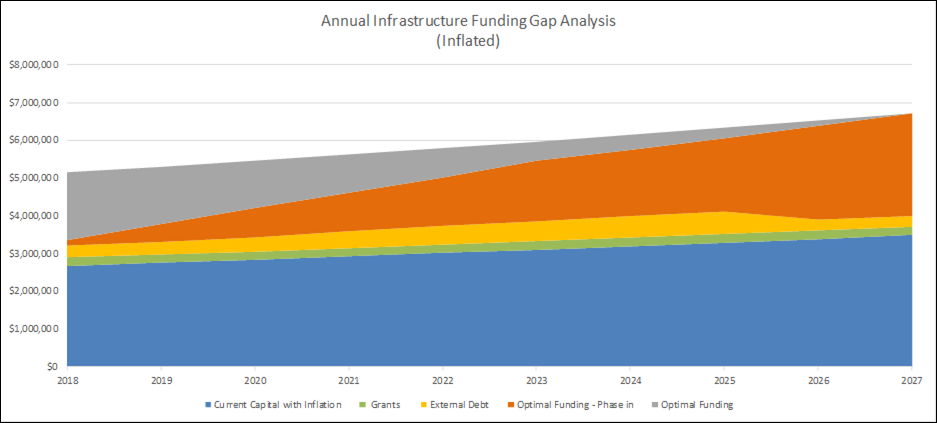
Figure 6‑8
Scenario 2 – Annual Infrastructure Funding Gap
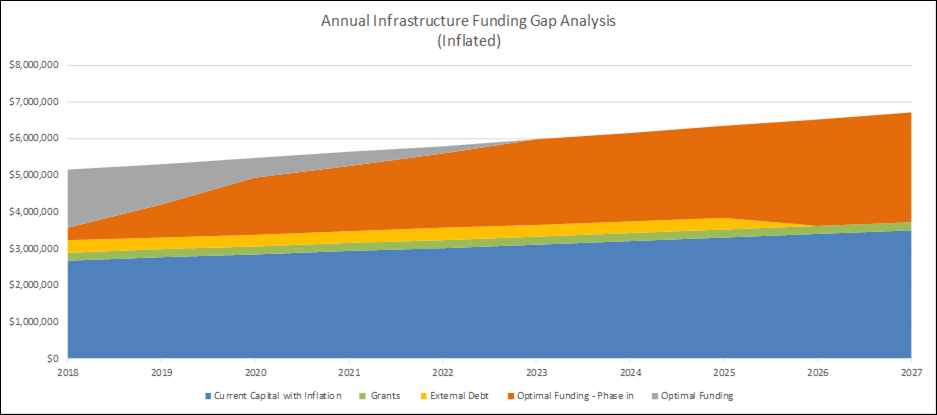
Does your financing strategy include other performance and sustainability measures?
Background
The current and ongoing performance of the asset management financing strategy as well as the level of sustainability that is being achieved can be evaluated by a number of financial indicators. It is important to develop objective measures and track them over time to identify areas in need of improvement and evaluate progress towards meeting targets. Therefore, performance measures should be developed that are SMART:
· Specific;
· Measurable;
· Achievable;
· Relevant; and
· Timebound.
Levels of Maturity – Performance and Sustainability Measures
Does your financing strategy include other performance and sustainability measures?
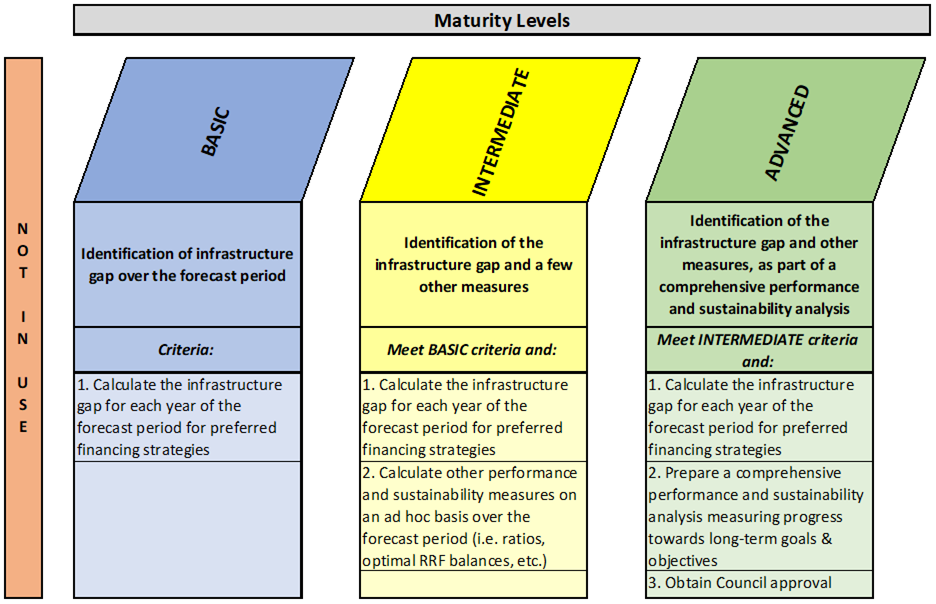
At the basic level of maturity, municipalities identify the amount of the infrastructure gap for each year of the forecast period. This calculation would typically be carried out for preferred financing strategies in order to provide a metric for assessing the relative impacts of these financing strategies.
At the intermediate level of maturity, not only would the infrastructure gap be calculated for preferred financing strategies for each year of the forecast period, but additional performance and sustainability measures would also be calculated. These additional measures would include calculations of ratios, optimal reserve/reserve fund balances, etc., and be generally done on an ad hoc basis over the forecast period.
At the advanced level of maturity, the identification of the infrastructure gap and other measures as identified in the intermediate level of maturity would be undertaken, but as part of a comprehensive performance and sustainability analysis. To accomplish this, municipalities would undertake the calculation of the infrastructure gap for each year of the forecast period for preferred financing strategies. A comprehensive performance and sustainability analysis would be prepared with the objective of measuring progress towards long-term goals and objectives. Finally, the results of the analysis would be presented to Council regularly (i.e. annually) for their approval.
Infrastructure Gap
As municipalities strive to balance the desire to maintain an affordable tax rate (and/or user fee rate) with the annual funding requirements identified in the asset management plan, often, the resulting strategy is to defer significant capital replacements in order to minimize short-term budget impacts. This approach creates an infrastructure gap, which affects levels of service, creates a higher risk of asset failure, and/or results in increased costs associated with maintaining an asset past its useful life. Municipalities often have not other option, even with these disadvantages considered.
For example, a municipality may be aware that a $1 million asset is in need of replacement this year to maintain expected levels of service. However, due to financial constraints, the municipality has decided not to replace the asset. This means an infrastructure gap of $1 million has been created. An illustrative example is provided below, at the end of this section.
Other Performance/Sustainability Measures
Other performance measures can also be used to evaluate the financing strategy effectiveness. For example:
1. Customer affordability comparison of rates/fees to neighbouring municipalities or provincial averages.
2. The ratio of total capital reserves/reserve fund balances to total assets’ replacement cost (inflated) provides an indication of sustainability and the financial preparedness of a municipality to cover lifecycle costs without the expectation of taking on debt.
3. The ratio of total debt outstanding to tangible capital assets (at replacement cost) provides another measure of sustainability and the financial preparedness of a municipality to cover lifecycle costs without the expectation of taking on additional debt.
4. The calculation of the availability of annual debt capacity, as described earlier in this Chapter. Municipalities must ensure they remain below the annual repayment limit, and therefore, it is prudent to analyse impacts of the financing strategy on this constraint.
Example – Infrastructure Gap
Under both scenarios, the infrastructure gap is identical, as shown in Table 6‑20 (below) (and previously discussed in other sections):
Table 6‑20
Sample Scenario Comparison – Infrastructure Gap
|
Category |
Optimal Expected LOS |
Scenario 1 Capital Deferral, Use of External Debt |
Scenario 2 Capital Deferral, No External Debt |
|
Capital (Inflated) over 5 Years |
$35,300,000 |
$24,291,100 |
$24,291,100 |
|
Capital (Inflated) over 10 Years |
$63,300,000 |
$54,197,800 |
$54,197,800 |
|
Infrastructure Gap (Inflated) |
None |
$11,008,900 – First 5 Years |
$11,008,900 – First 5 Years |
|
$9,102,200 – Next 5 Years |
$9,102,200 – Next 5 Years |
Figure 6‑9 provides a graphical representation of the infrastructure deficit over the forecast period under either scenario. The cumulative infrastructure gap is projected to grow until 2023, and then begins to reduce annually thereafter. However, by 2027, an infrastructure gap still remains. While the infrastructure funding gap outlined in Figures 6-7 and 6-8 reflect the municipality reaching optimal annual investment amounts by 2027, an infrastructure gap still exists from a cost perspective as a “backlog” of infrastructure accumulated while the municipality increased investments levels over time towards optimal levels. This outlines the benefit of calculating gaps, both from an investment (i.e. funding) and from an infrastructure (i.e. cost) perspective within the asset management plan. Target years can be documented, outlining the desired years that both the infrastructure funding gap and the infrastructure gap are eliminated. Alternatively, a municipality’s goal could be to illustrate gaps that are consistently being mitigated over the forecast period.
Figure 6‑9
Sample Infrastructure Gap
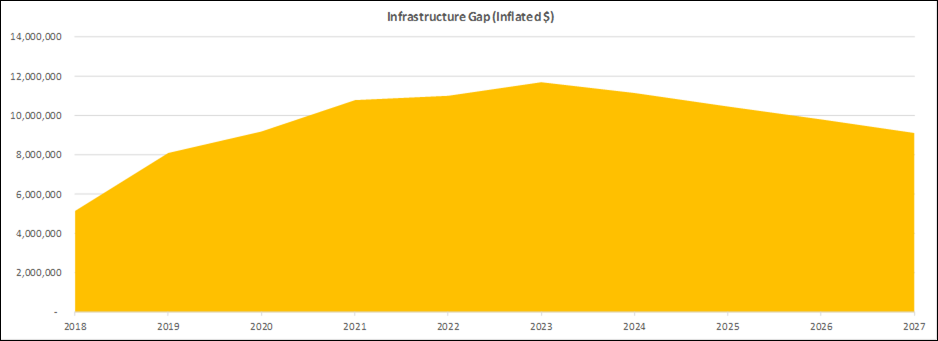
Does your infrastructure funding gap analysis consider how the gap will be managed?
Background
In the section above, the importance of including a funding gap analysis within the Financing Strategy was discussed. Taking this one step further, the ability to plan how that funding gap will be reduced and eventually eliminated over the forecast period (or beyond) provides significant performance metrics with respect to the overall success of the AM plan.
Levels of Maturity
Does your infrastructure funding gap analysis consider how the gap will be managed?
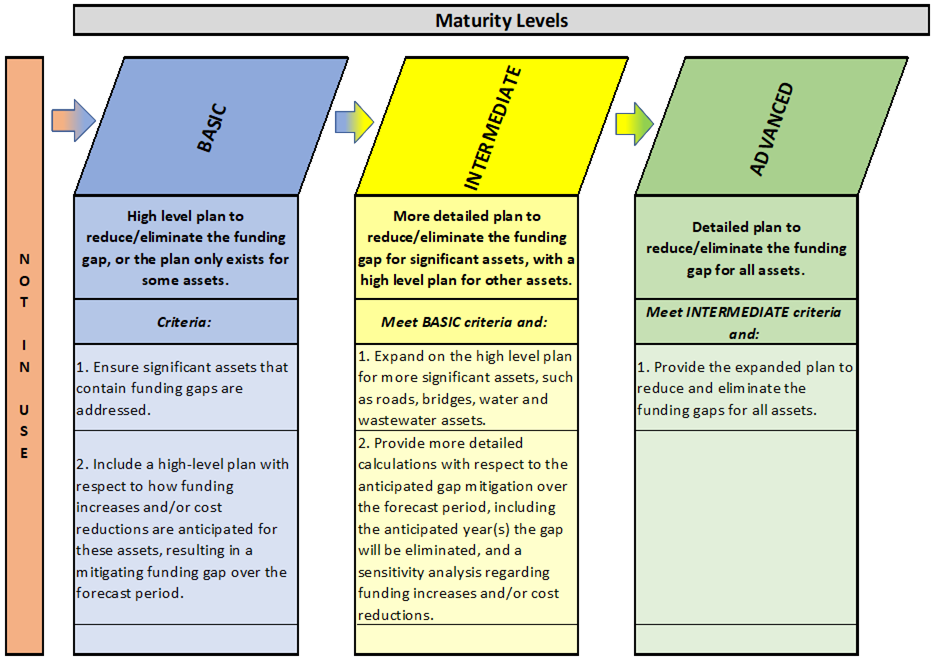
At the basic level of maturity, municipalities have a high-level plan in place to reduce or eliminate the funding gap. The plan may not cover most assets, but it should address funding gaps for significant assets. The plan should detail approaches for mitigating funding gaps during periods of anticipated funding increases/reductions.
At the intermediate level of maturity, municipalities have a moderately detailed plan to reduce or eliminate the funding gap for significant assets, such as bridges, water and wastewater assets. The plan should include a sensitivity analysis regarding funding increases/reductions as well as detailed calculations to reduce the gap over the forecast period. At this level, municipalities also have a high-level plan for other assets.
At the advanced level of maturity, municipalities have a detailed plan to reduce or eliminate the funding gap for all assets.
Mitigating the Infrastructure Funding Gap
The ability to forecast the planned reduction in the infrastructure funding gaps allows municipalities to illustrate the overall effectiveness of a recommended financing strategy over AM plan itself. The use of the terminology “gaps” refers to the fact that municipalities can have multiple funding gaps, such as tax supported and user fee supported (i.e. water, wastewater, solid waste, parking, etc.).
Including a sensitivity analysis within this area also provides a “cause/effect” or consequence of decisions to both Council and the public. For example, if a municipality is recommending a 2.0% capital levy increase to support the AM plan and Council is willing to adopt a 1.0% increase, the following information can be provided:
· 1.0% Capital Levy Increase: Anticipated Funding Gap Elimination: 2055
· 1.5% Capital Levy Increase: Anticipated Funding Gap Elimination: 2045
· 2.0% Capital Levy Increase: Anticipated Funding Gap Elimination: 2035
This data, along with the other implications of a reduced Financing Strategy (asset condition, risk and level of service) can be presented to Council and the public during budget deliberations.
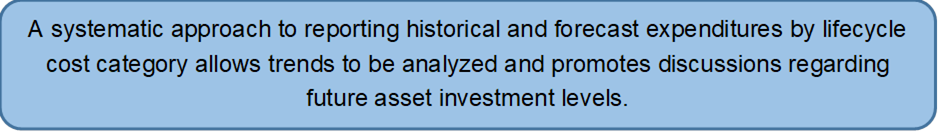
Does your financing strategy include a yearly expenditure breakdown (both historical and forecast) by lifecycle category?
Background
To complete many of the analyses detailed in this chapter, the necessary background financial information will need to be documented as part of the asset management plan. It may be useful to complete the financial information separately for activities supported by taxation versus user fee(s).
To integrate the financial strategy into the asset management plan, a long-term forecast of expenditures and revenues will be required. The forecast should cover a minimum of ten years, but best practice would suggest using a timeframe that coincides with the lifecycle time period of all capital assets.
Annual expenditures should be forecasted for the following lifecycle categories:
a) Non-infrastructure solutions;
b) Maintenance activities;
c) Renewal/Rehabilitation activities;
d) Replacement activities;
e) Disposal activities; and
f) Expansion activities.
To provide historical perspective, the actual expenditures for the above categories should also be included for a defined period.
Levels of Maturity – Expenditure Reporting
Does your financing strategy include a yearly expenditure breakdown (both historical and forecast) by lifecycle category?
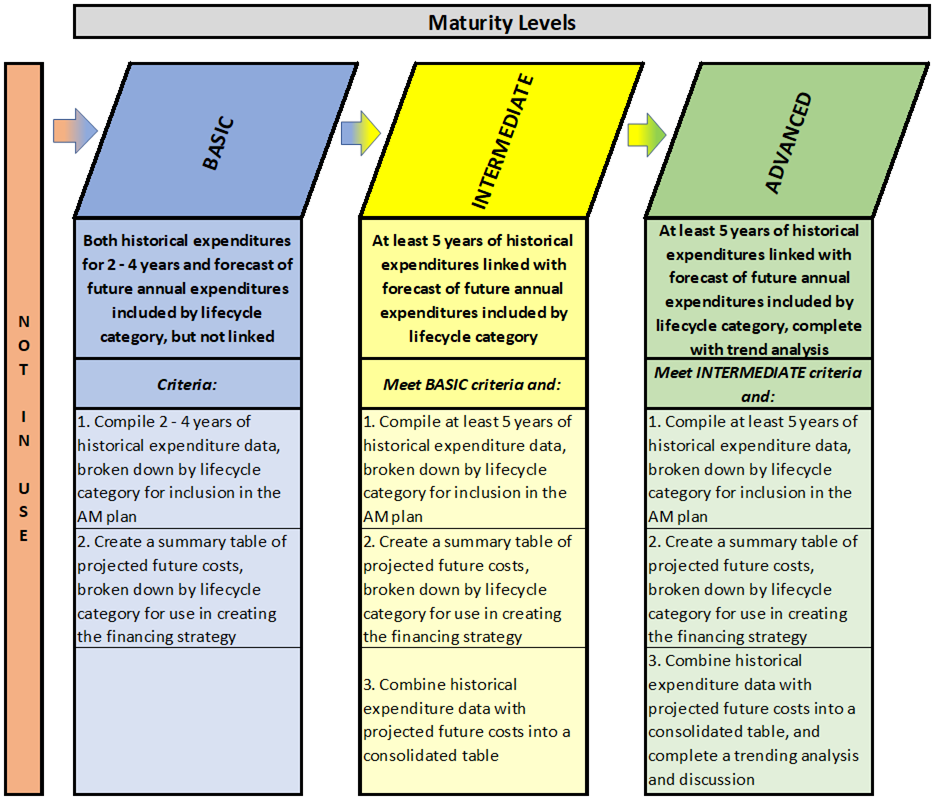
At the basic level of maturity, municipalities prepare two expenditure summaries by lifecycle category, with one representing historical annual expenditures and the second including projected annual expenditures. The two summaries would be prepared in isolation and not linked. The historical annual expenditures for the past two to four years would be compiled by lifecycle category and included in the asset management plan. A summary table would also be created of the projected future annual costs which would be broken down by lifecycle category for use in creating the financing strategy.
At the intermediate level of maturity, expenditures are summarized by lifecycle category, with at least five years of historical expenditures being linked with a forecast of future annual expenditures. This would require the municipality to compile at least five years of historical expenditure data by lifecycle category and include this information in the asset management plan. Projected annual future costs summarized by lifecycle category would be included in a summary table for use in creating the financing strategy. These two expenditure summaries would be combined into a consolidated table, providing a more comprehensive and informative representation.
At the advanced level of maturity, the same steps undertaken at the intermediate level of maturity are followed. However, once the consolidated table of historical and projected expenditures was prepared, a trend analysis would be undertaken. This would provide the opportunity to identify any tendencies that need further investigation and to promote discussion about opportunities for managing costing levels.
Expenditure Reporting – Example
The example tables and figures below are based on the financing strategy example (Scenario 1 – Issue Debt) outlined in other sections above:
Table 6‑21
Sample Capital Expenditure Reporting – Table Format
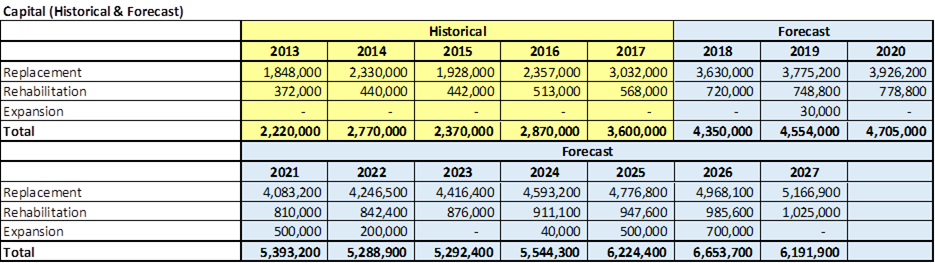
Figure 6‑10
Sample Capital Expenditure Reporting – Chart Format
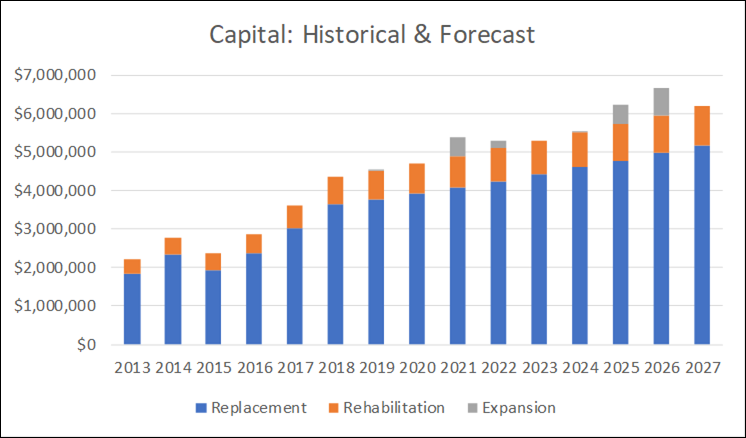
Table 6‑22
Sample Operating Expenditure Reporting – Table Format
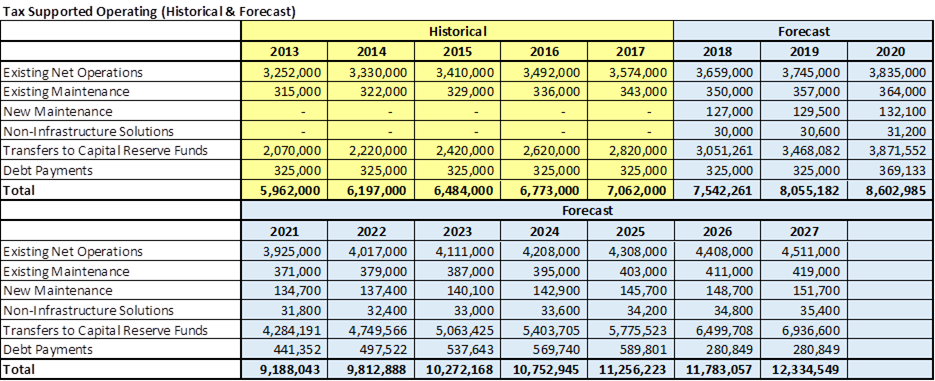
Figure 6‑11
Sample Operating Expenditure Reporting – Chart Format
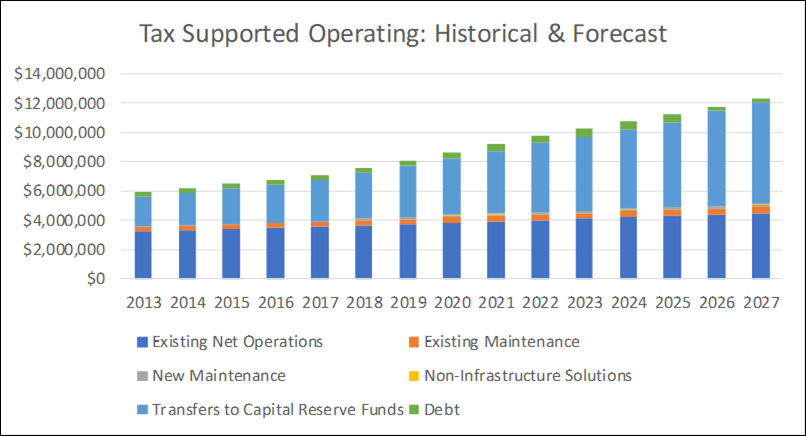
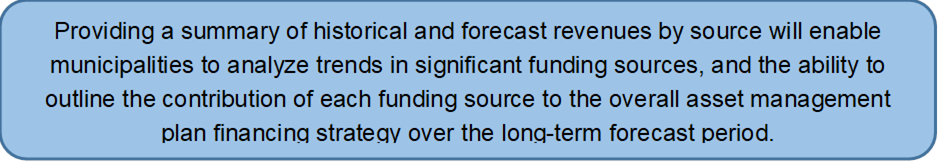
Does your financing strategy include yearly revenues broken down by confirmed source?
Background
Annual revenues by confirmed source should be reported as part of the asset management plan. This includes revenue sources such as taxation, user fees, debt, gas tax, other grants, reserves/reserve funds, etc. In addition, both historical and projected future revenue need to be represented in the analysis, either independently or in a combined analysis.
Levels of Maturity – Revenue Reporting
Does your financing strategy include yearly revenues broken down by confirmed source?
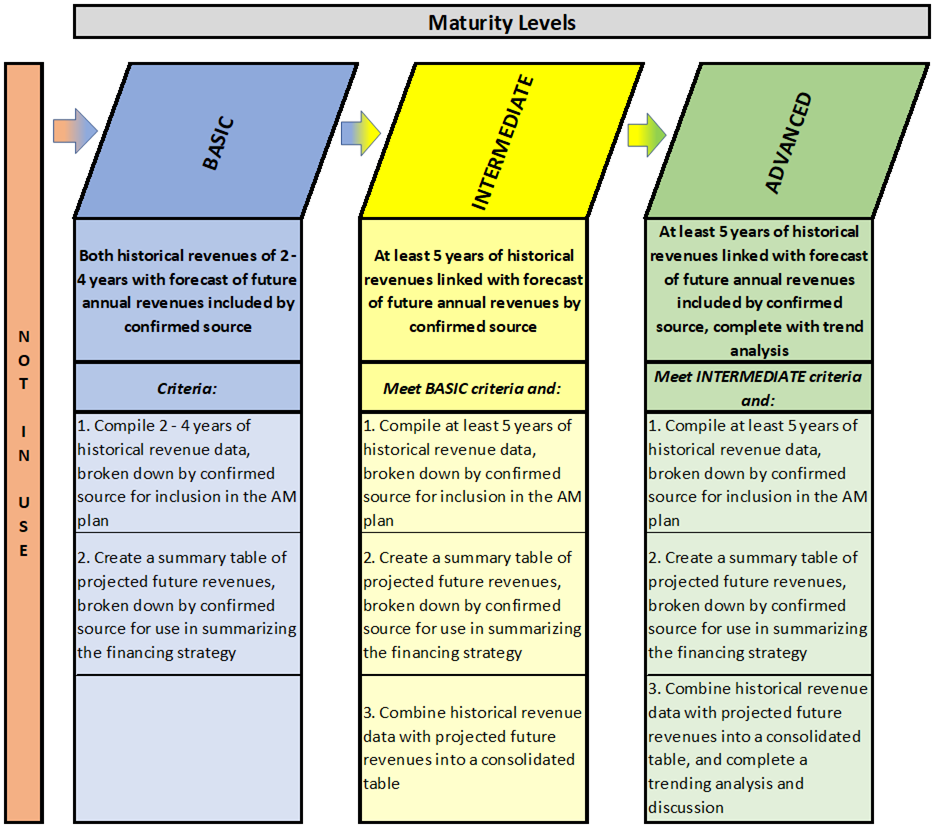
At the basic level of maturity, municipalities prepare two revenue summaries by confirmed source, with one representing historical annual revenues and the second including projected annual revenues. The two summaries would be prepared in isolation and not linked. The historical annual revenues for the past two to four years would be compiled by confirmed source and included in the asset management plan. A summary table would also be created of the projected future annual revenues, by confirmed source, for use in summarizing the financing strategy.
At the intermediate level of maturity, revenues are summarized by confirmed source with at least five years of historical revenues being linked, with a forecast of future annual revenues. This would require the municipality to compile at least five years of historical revenue data, by confirmed source, and include this information in the asset management plan. Projected annual future revenues summarized by confirmed source would be included in a summary table for use in summarizing the financing strategy. These two revenue summaries would be combined into a consolidated table, providing a more comprehensive and informative representation.
At the advanced level of maturity, the same steps undertaken at the intermediate level of maturity are followed. However, once the consolidated table of historical and projected revenues was prepared, a trend analysis would be undertaken. This would provide the opportunity to identify any tendencies that need further investigation, and to promote discussion about opportunities for managing revenue levels.
Revenue Reporting - Example
Table 6‑23 and Figure 6‑12 below are based on the financing strategy example (Scenario 1 – Issue Debt) outlined in other sections above:
Table 6‑23
Sample Capital Revenue Reporting – Table Format
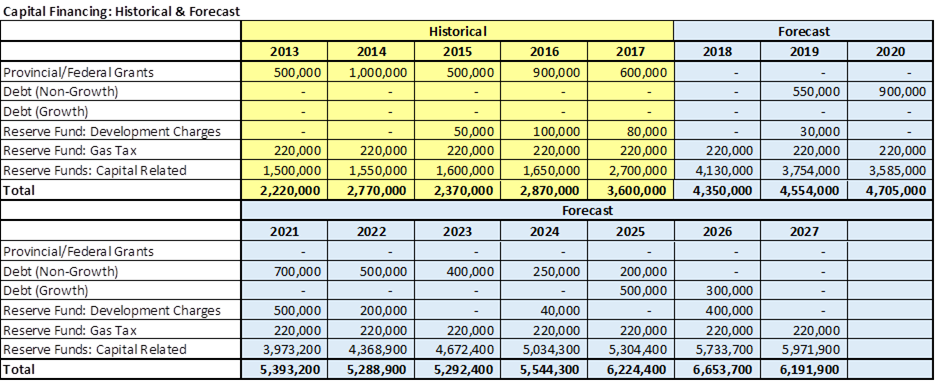
Figure 6‑12
Sample Capital Revenue Reporting – Chart Format
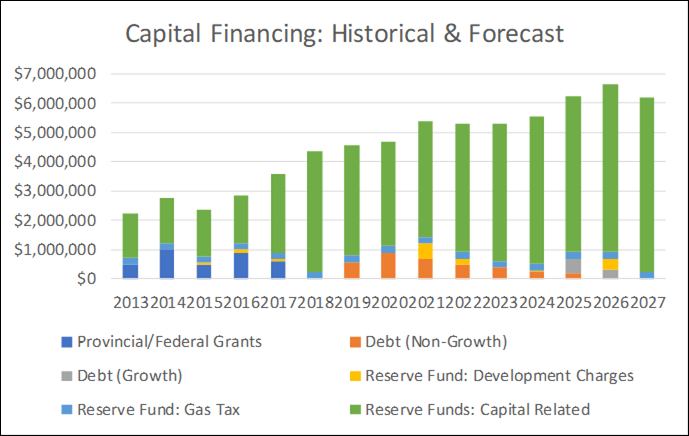
Institute of Public Works Engineering Australasia, 2015, International Infrastructure Management Manual, https://www.ipwea.org/publications/bookshop/ipweabookshop/iimm
International Organization for Standardization (ISO), 2014, ISO 55000:2014, Asset management – Overview, principles and terminology, http://www.iso.org/iso/catalogue_detail?csnumber=55088
Province of Ontario, 1997, Development Charges Act, https://www.ontario.ca/laws/statute/97d27
Province of Ontario, 2001, Municipal Act, 2001https://www.ontario.ca/laws/statute/01m25
Province of Ontario, Ministry of Infrastructure, 2012, Building Together: Guide for Municipal Asset Management Plans, https://www.ontario.ca/page/building-together-guide-municipal-asset-management-plans
[1] It is noted that exceptions to this rule may be made through appeal to the Ontario Municipal Board.
[2] Surplus in this context refers to modified accrual (budget) surplus. Please refer to a comparison of accounting methods at http://www.mah.gov.on.ca/Page15030.aspx